USD/JPY Price Analysis: A lurking rising wedge could open the door towards 132.00


  • The USD/JPY extends its weekly gains to 0.74% on Tuesday.
  • Falling US Treasury yields capped any U¨SD/JPY’s attempts towards the YTD highs near 136.70s.
  • A rising wedge in the USD/JPY daily chart looms; if it plays out, it will send the pair tumbling towards 132.00.

The USD/JPY extends its string of days, advancing to three straight, and registers a new weekly high near the 136.30s after bouncing from daily lows at around 135.10s earlier in the Asian session, gaining close to 80 pips in the day. At the time of writing, the USD/JPY is trading at 136.10.

Wall Street’s Tuesday session ended with substantial losses, between 1.56% and 3.09%. A risk-off mood impulse, usually a headwind for the major, backfired on the Japanese yen, which remains heavy on the Bank of Japan’s (BoJ) pledging for an ultra-loose monetary policy stance, despite dealing with a weaker JPY, which makes inflation less tolerable.

In the meantime, US Treasury yields receded from weekly highs. The US 10-year benchmark note rate edges down one basis point and sits at 3.183%, putting a lid on higher USD/JPY prices.
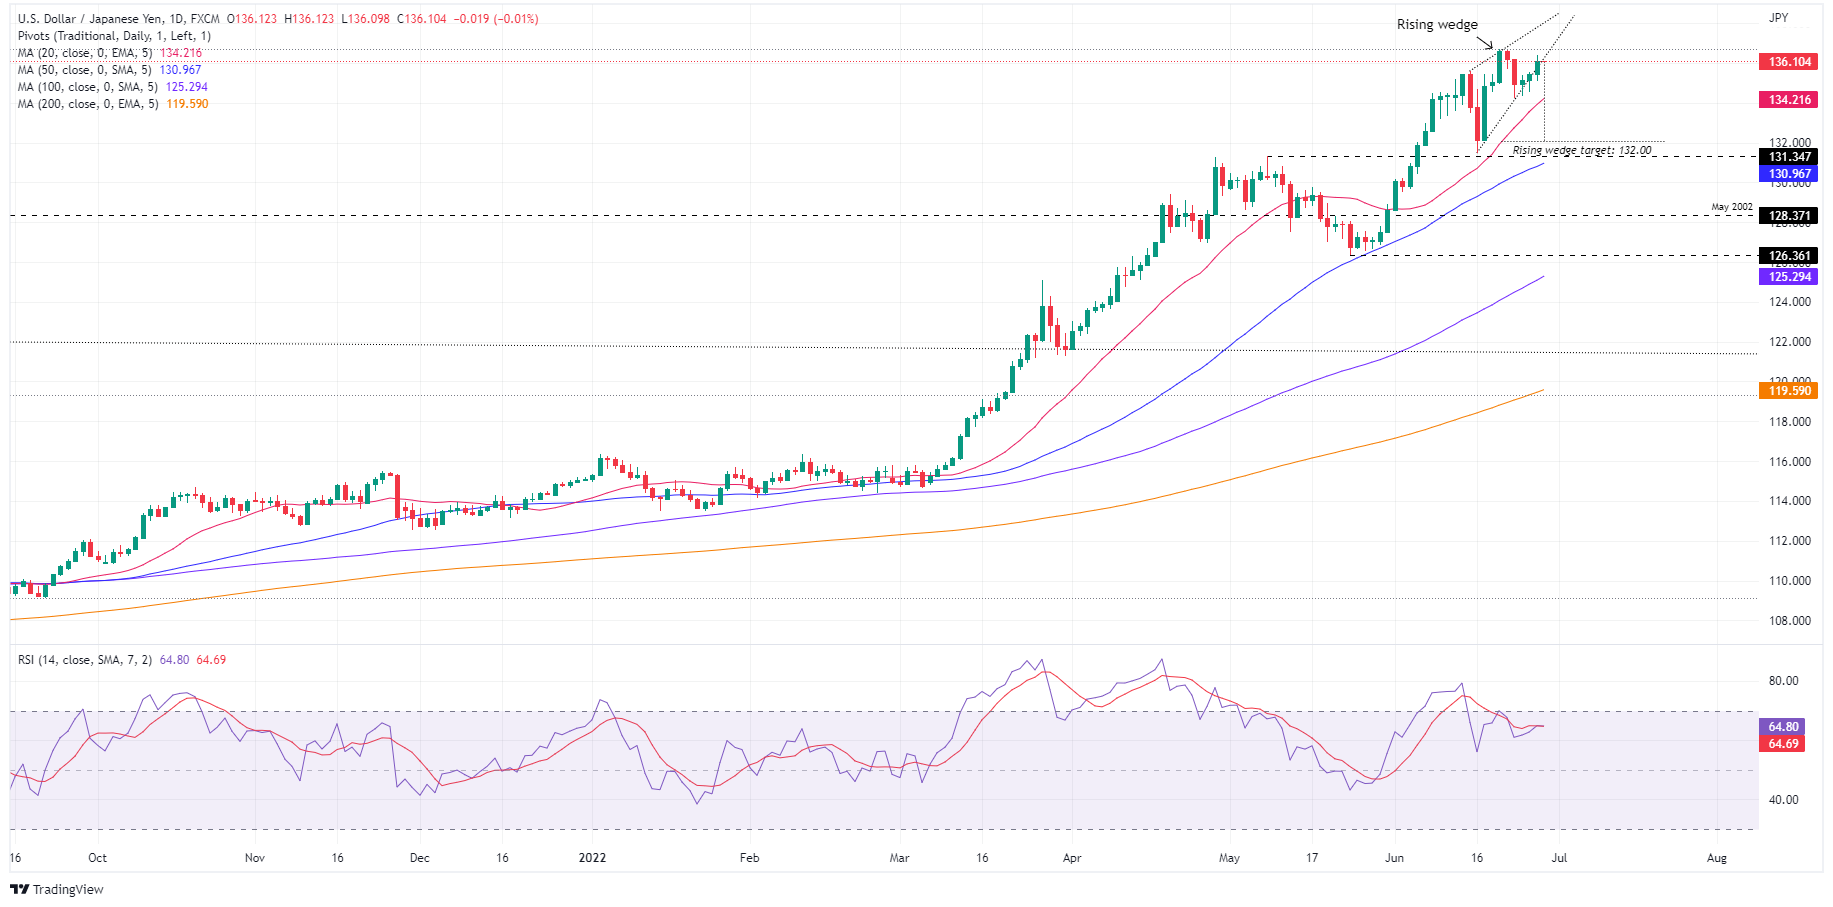
USD/JPY Daily chart

The USD/JPY is still upward biased, albeit closing to YTD highs and “verbal” intervention by Japanese authorities. However, price action begins to show the possible formation of a rising wedge, which would pave the way for a pullback. If that scenario plays out, the USD/JPY first target would be the 20-EMA at 133.92, followed by the June 16 swing low at 131.49. USD/JPY traders should be aware that once the latter’s cleared, the 50-EMA at around 130.80 would be in play.

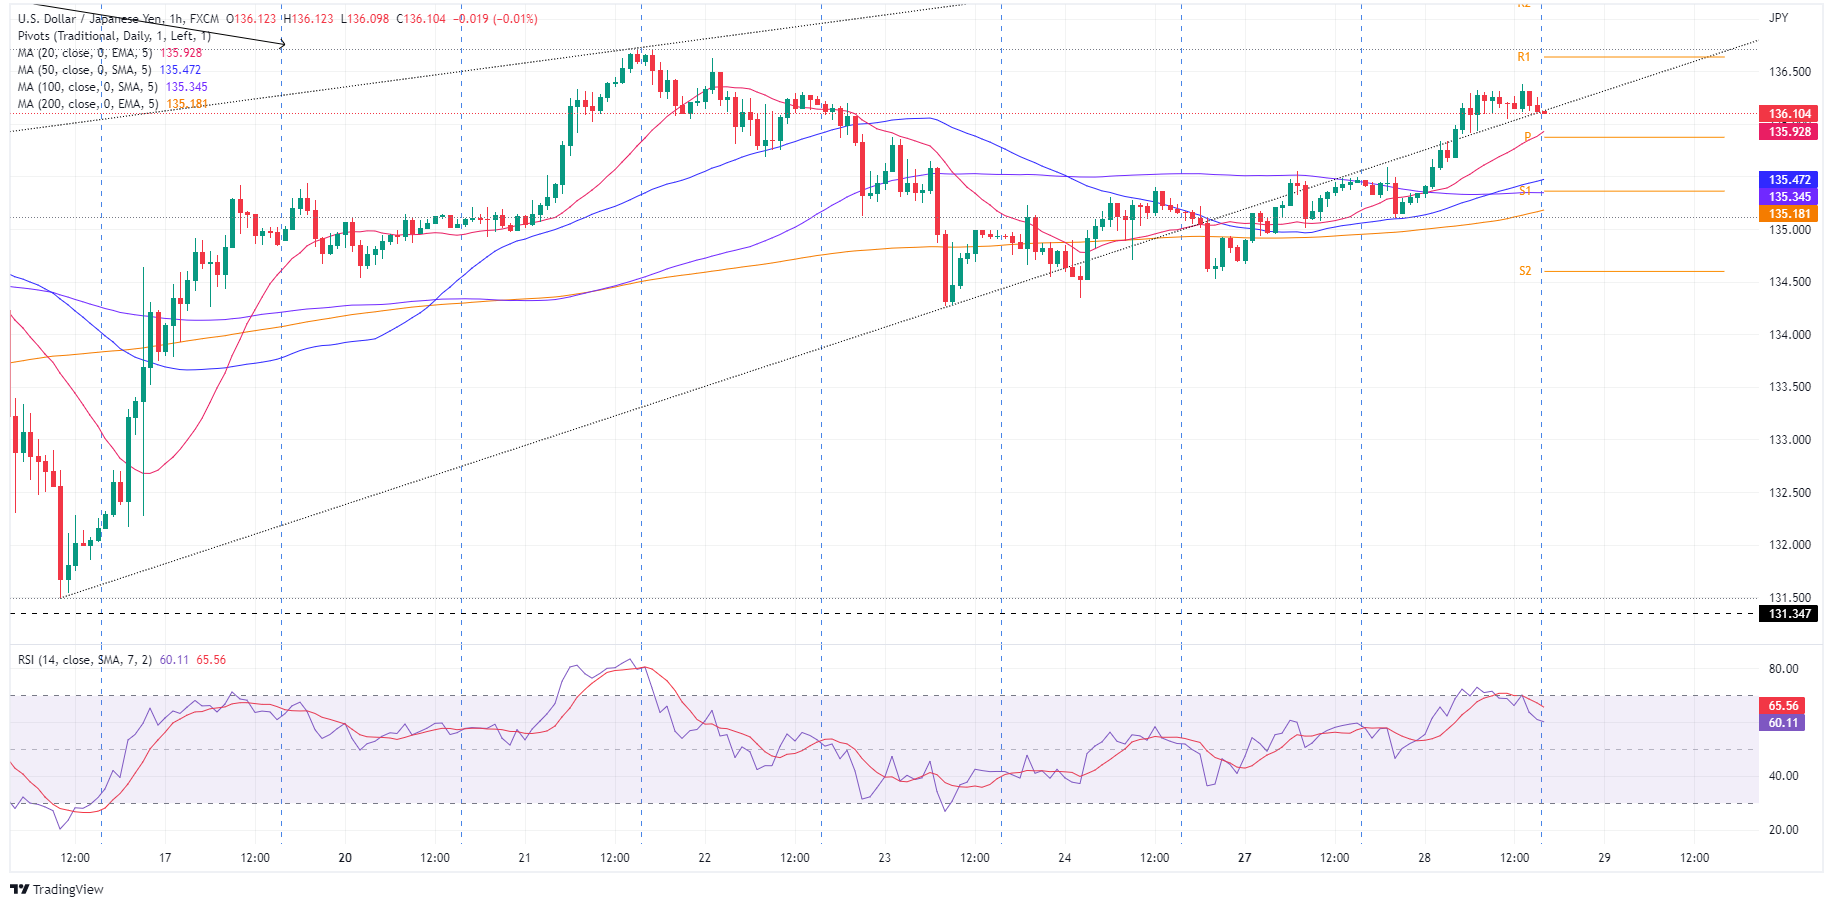
USD/JPY Hourly chart

The USD/JPY consolidates around the 135.00-136.20 area, clinging to Tuesday’s R2 daily pivot at 136.21. Traders should notice that the Relative Strength Index (RSI), albeit at 63.26, is aiming lower and trending below RSI’s 7-period SMA, a bearish signal suggesting downward pressure lying ahead.

USD/JPY buyers’ failure to break above 136.21 might open the door for further losses. That said, the major’s first support would be 136.00. Break below would expose the 20-EMA at 135.88, followed by the confluence of the 50 and 100-EMA around 135.45-34, respectively, and then the 200-EMA at 135.16.

Conversely, a USD/JPY’s upward break above 136.21 might open the door for a YTD test at 136.71.

USD/JPY Key Technical Levels

USD/JPY

Overview
Today last price 136.10
Today Daily Change 0.73
Today Daily Change % 0.54
Today daily open 135.45
 
Trends
Daily SMA20 133.58
Daily SMA50 130.69
Daily SMA100 124.91
Daily SMA200 119.34
 
Levels
Previous Daily High 135.55
Previous Daily Low 134.52
Previous Weekly High 136.72
Previous Weekly Low 134.26
Previous Monthly High 131.35
Previous Monthly Low 126.36
Daily Fibonacci 38.2% 135.16
Daily Fibonacci 61.8% 134.92
Daily Pivot Point S1 134.8
Daily Pivot Point S2 134.15
Daily Pivot Point S3 133.77
Daily Pivot Point R1 135.83
Daily Pivot Point R2 136.2
Daily Pivot Point R3 136.86


Share: Feed news

Information on these pages contains forward-looking statements that involve risks and uncertainties. Markets and instruments profiled on this page are for informational purposes only and should not in any way come across as a recommendation to buy or sell in these assets. You should do your own thorough research before making any investment decisions. FXStreet does not in any way guarantee that this information is free from mistakes, errors, or material misstatements. It also does not guarantee that this information is of a timely nature. Investing in Open Markets involves a great deal of risk, including the loss of all or a portion of your investment, as well as emotional distress. All risks, losses and costs associated with investing, including total loss of principal, are your responsibility. The views and opinions expressed in this article are those of the authors and do not necessarily reflect the official policy or position of FXStreet nor its advertisers. The author will not be held responsible for information that is found at the end of links posted on this page.

If not otherwise explicitly mentioned in the body of the article, at the time of writing, the author has no position in any stock mentioned in this article and no business relationship with any company mentioned. The author has not received compensation for writing this article, other than from FXStreet.

FXStreet and the author do not provide personalized recommendations. The author makes no representations as to the accuracy, completeness, or suitability of this information. FXStreet and the author will not be liable for any errors, omissions or any losses, injuries or damages arising from this information and its display or use. Errors and omissions excepted.

The author and FXStreet are not registered investment advisors and nothing in this article is intended to be investment advice.

Recommended content


Recommended content

Editors’ Picks

EUR/USD clings to daily gains above 1.0650

EUR/USD clings to daily gains above 1.0650

EUR/USD gained traction and turned positive on the day above 1.0650. The improvement seen in risk mood following the earlier flight to safety weighs on the US Dollar ahead of the weekend and helps the pair push higher.

EUR/USD News

GBP/USD recovers toward 1.2450 after UK Retail Sales data

GBP/USD recovers toward 1.2450 after UK Retail Sales data

GBP/USD reversed its direction and advanced to the 1.2450 area after touching a fresh multi-month low below 1.2400 in the Asian session. The positive shift seen in risk mood on easing fears over a deepening Iran-Israel conflict supports the pair.

GBP/USD News

Gold holds steady at around $2,380 following earlier spike

Gold holds steady at around $2,380 following earlier spike

Gold stabilized near $2,380 after spiking above $2,400 with the immediate reaction to reports of Israel striking Iran. Meanwhile, the pullback seen in the US Treasury bond yields helps XAU/USD hold its ground.

Gold News

Bitcoin Weekly Forecast: BTC post-halving rally could be partially priced in Premium

Bitcoin Weekly Forecast: BTC post-halving rally could be partially priced in

Bitcoin price shows no signs of directional bias while it holds above  $60,000. The fourth BTC halving is partially priced in, according to Deutsche Bank’s research. 

Read more

Week ahead – US GDP and BoJ decision on top of next week’s agenda

Week ahead – US GDP and BoJ decision on top of next week’s agenda

US GDP, core PCE and PMIs the next tests for the Dollar. Investors await BoJ for guidance about next rate hike. EU and UK PMIs, as well as Australian CPIs also on tap.

Read more

Forex MAJORS

Cryptocurrencies

Signatures