|

USD/JPY jumps to 140.00 as US yields soar

  • USD/JPY rose past the 140.00 zone during the New York session.
  • The US Dollar cleared daily losses amid rising US bond yields and a cautious market mood.
  • Investors await Q1 Gross Domestic Product data from Japan.

The USD/JPY pair rose for a second consecutive day on Wednesday to currently trade around 140.00. On the other hand, as per the DXY index, the USD weakened against most of its rivals earlier but cleared daily losses finding support at 103.66 and recovering above 104.00 on the back of significant increases in the US bond yields. Another surprising rate hike, this time by the Bank of Canada (BoC), increased slightly the hawkish bets on the Fed.

BoC surprise decision fueled hawkish bets on the Fed

Market expectations for the upcoming June 13-14 Federal Reserve (Fed) still favour a no-hike despite the BoC surprise hike on Wednesday boosted prospects of another Fed hike.  According to the CME FedWatch Tool, investors are betting on higher odds (64.7%) of the Fed not raising interest rates with expectations of maintaining the target rate at 5.25% but the probabilities of a 25 bps hike jumped to 30%

Against this backdrop, the US bond yields are seeing increases across the curve. The 10-year bond yield rose to 3.78%, while the 2-year yield stands at 4.59% and the 5-year yielding 3.94%, all up on the day,  lifting the US Dollar.

On the other hand, the Yen's decline might be limited by speculations of Japanese authorities intervening in the markets to support the domestic currency. For Wednesday’s session, a cautious market mood amid weak Chinese economic data reported during the Asia session weighed on the JPY as it fueled a risk-off market mood.

USD/JPY levels to watch

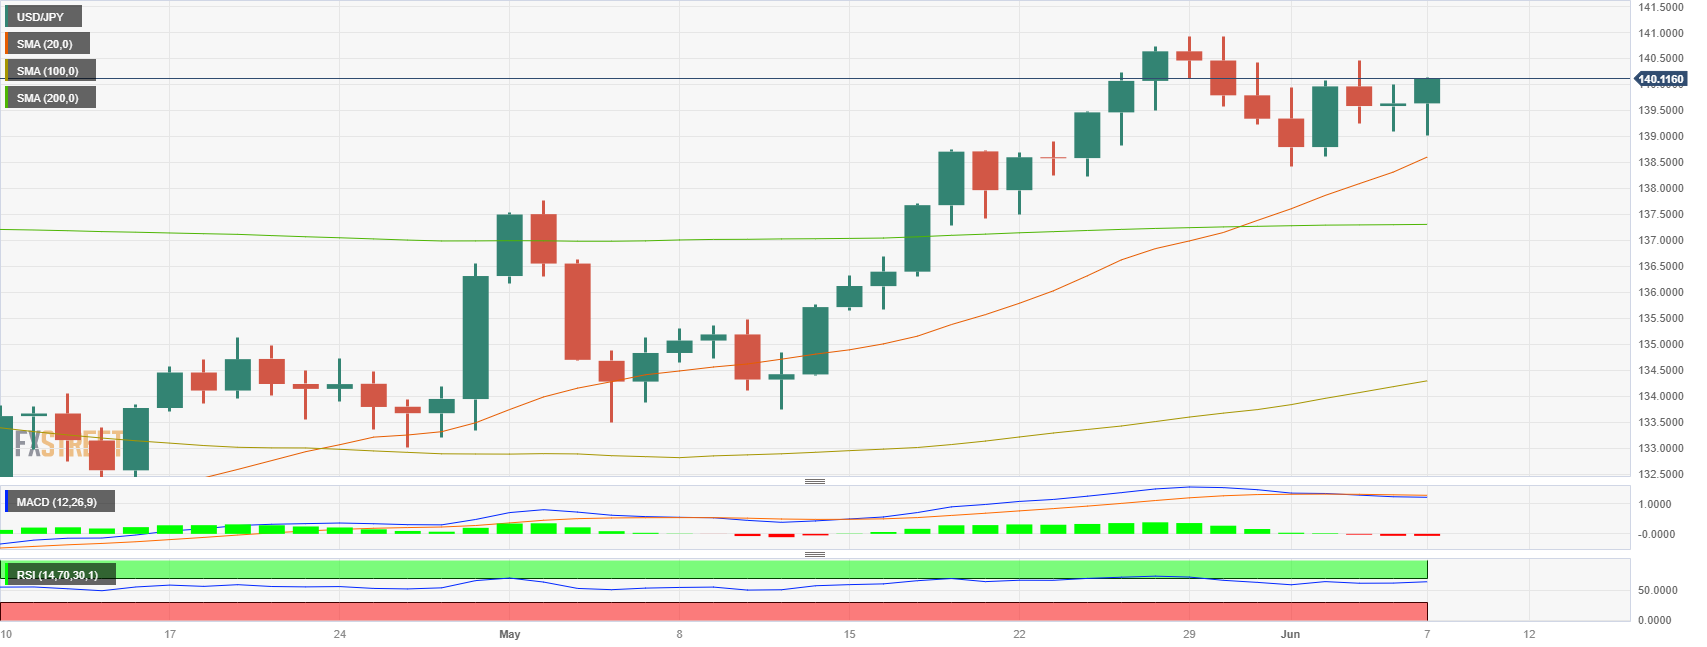
According to the daily chart, the USD/JPY holds a neutral to bullish outlook for the short term. The Relative Strength Index (RSI) holds resilient above its midline while the Moving Average Convergence Divergence (MACD) fell slightly to the negative zone, but the pair trading above the 20-,100- and 200-day Simple Moving Averages (SMAs) suggests that the overall technical outlook is positive for the pair.

If USD/JPY manages to move higher, the next resistance to watch is at the 140.00 level, followed by the 140.50 zone and the psychological mark at 141.00. On the other hand, the 139.50 zone level is key for USD/JPY to maintain its upside bias. If breached, the pair could see a steeper decline towards the 139.00 psychological level and weekly low and then at the 20-day Simple Moving Average (SMA) at 138.60.

USD/JPY daily chart

USD/JPY

Overview
Today last price140.13
Today Daily Change0.49
Today Daily Change %0.35
Today daily open139.64
 
Trends
Daily SMA20138.31
Daily SMA50135.65
Daily SMA100134.18
Daily SMA200137.3
 
Levels
Previous Daily High140
Previous Daily Low139.1
Previous Weekly High140.93
Previous Weekly Low138.43
Previous Monthly High140.93
Previous Monthly Low133.5
Daily Fibonacci 38.2%139.65
Daily Fibonacci 61.8%139.44
Daily Pivot Point S1139.16
Daily Pivot Point S2138.68
Daily Pivot Point S3138.26
Daily Pivot Point R1140.06
Daily Pivot Point R2140.48
Daily Pivot Point R3140.96

Author

Patricio Martín

Patricio is an economist from Argentina passionate about global finance and understanding the daily movements of the markets.

More from Patricio Martín
Share:

Markets move fast. We move first.

Orange Juice Newsletter brings you expert driven insights - not headlines. Every day on your inbox.

By subscribing you agree to our Terms and conditions.

Editor's Picks

EUR/USD bounces toward 1.1750 as US Dollar loses strength

EUR/USD returned to the 1.1750 price zone in the American session on Friday, despite falling Wall Street, which indicates risk aversion. Trading conditions remain thin following the New Year holiday and ahead of the weekend, with the focus shifting to US employment and European data scheduled for next week.

GBP/USD nears 1.3500, holds within familiar levels

After testing 1.3400 on the last day of 2025, GBP/USD managed to stage a rebound. Nevertheless, the pair finds it difficult to gather momentum and trades with modest intraday gains at around 1.3490 as market participants remain in holiday mood.

Gold trims intraday gains, approaches $4,300

Gold retreated sharply from the $4,400  area and trades flat for the day in the $4,320 price zone. Choppy trading conditions exacerbated the intraday decline, although XAU/USD bearish case is out of the picture, considering growing expectations for a dovish Fed and persistent geopolitical tensions.

Cardano gains early New Year momentum, bulls target falling wedge breakout

Cardano kicks off the New Year on a positive note and is extending gains, trading above $0.36 at the time of writing on Friday. Improving on-chain and derivatives data point to growing bullish interest, while the technical outlook keeps an upside breakout in focus.

Economic outlook 2026-2027 in advanced countries: Solidity test

After a year marked by global economic resilience and ending on a note of optimism, 2026 looks promising and could be a year of solid economic performance. In our baseline scenario, we expect most of the supportive factors at work in 2025 to continue to play a role in 2026.

Crypto market outlook for 2026

Year 2025 was volatile, as crypto often is.  Among positive catalysts were favourable regulatory changes in the U.S., rise of Digital Asset Treasuries (DAT), adoption of AI and tokenization of Real-World-Assets (RWA).