|

USD/JPY cracks 114.00 amid USD weakness and bearish wedge

  • USD/JPY eyes deeper losses below 114.00 on DXY weakness.
  • US Treasury yields attempt a bounce ahead of Retail Sales.
  • Bearish wedge confirmation and daily close below 50-DMA cheer bears.

USD/JPY is flirting with three-week lows, losing the 114.00 level amid persistent weakness in the US dollar against its main peers and a technical breakdown on the daily sticks.

The slump in the greenback that ensued after the 40-year US high inflation numbers triggered “sell the news” in the dollar. The US currency continues to bear the brunt of the view that the real return is higher in Emerging Markets (EM).

Despite the renewed uptick in the US Treasury yields, USD/JPY bears remain unimpressed, at the time of writing, as traders refrain from creating any fresh positions in the major ahead of the key US Retail Sales release.

Additionally, the risk-off trading in the global indices offers support to the safe-haven yen, collaborating with the downside in the pair. Aggressive Fed’s tightening expectations spurred by hawkish Fedspeak weigh on the risk-sensitive equity markets worldwide.  

USD/JPY: Technical outlook

USD/JPY’s daily chart shows that the price has confirmed a rising wedge breakdown after closing Thursday below the ascending trendline support at 114.23. At that level, the mildly bullish 50-Daily Moving Average (DMA) also coincided.

The bearish wedge opens floors for additional losses towards the upward-sloping 100-DMA at 113.01. Ahead of that, the December 20 low of 113.32.

The 14-day Relative Strength Index (RSI) is pointing south below 50.00, allowing room for more declines.

USD/JPY: Daily chart

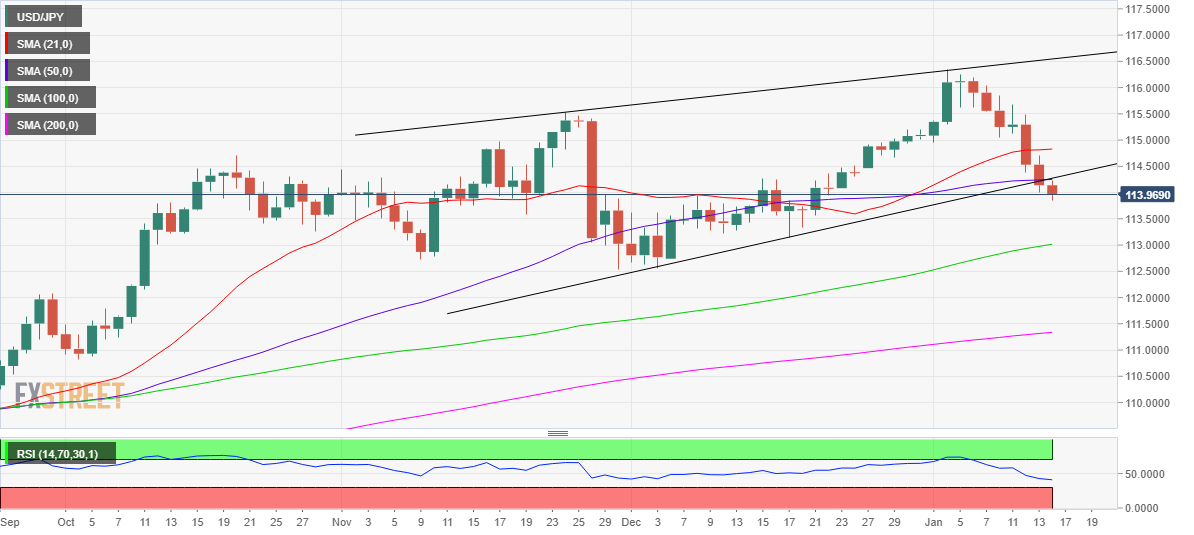
Any retracement will need acceptance above the aforesaid critical support now resistance at 114.23.

The next bullish target is seen at the 21-DMA of 114.82 on the road to recovery should 114.50 get cleared on a sustained basis.

USD/JPY: Additional levels to consider

USD/JPY

Overview
Today last price113.92
Today Daily Change-0.22
Today Daily Change %-0.19
Today daily open114.14
 
Trends
Daily SMA20114.87
Daily SMA50114.24
Daily SMA100112.97
Daily SMA200111.32
 
Levels
Previous Daily High114.7
Previous Daily Low114
Previous Weekly High116.35
Previous Weekly Low114.95
Previous Monthly High115.21
Previous Monthly Low112.56
Daily Fibonacci 38.2%114.27
Daily Fibonacci 61.8%114.44
Daily Pivot Point S1113.86
Daily Pivot Point S2113.58
Daily Pivot Point S3113.15
Daily Pivot Point R1114.56
Daily Pivot Point R2114.99
Daily Pivot Point R3115.27

Author

Dhwani Mehta

Dhwani Mehta

FXStreet

Residing in Mumbai (India), Dhwani is a Senior Analyst and Manager of the Asian session at FXStreet. She has over 10 years of experience in analyzing and covering the global financial markets, with specialization in Forex and commodities markets.

More from Dhwani Mehta
Share:

Editor's Picks

EUR/USD holds lower ground near 1.1850 ahead of EU/ US data

EUR/USD remains in the negative territory for the fourth successive session, trading around 1.1850 in European trading on Friday. A broadly cautious market environment paired with modest US Dollar demand undermines the pair ahead of the Eurozone GDP second estimate and the critical US CPI data. 

GBP/USD keeps losses around 1.3600, awaits US CPI for fresh impetus

GBP/USD holds moderate losses at around 1.3600 in the European session on Friday, though it lacks bearish conviction. The US Dollar remains supported amid softer risk tone and ahead of the US consumer inflation figures due later in the NA session on Friday. 

Gold trims intraday gains to $5,000 as US inflation data loom

Gold retreats from the vicinity of the $5,000 psychological mark, though sticks to its modest intraday gains heading into the European session. Traders now look forward to the release of the US consumer inflation figures for more cues about the Fed policy path. The outlook will play a key role in influencing the near-term US Dollar price dynamics and provide some meaningful impetus to the non-yielding bullion.

Solana: Mixed market sentiment caps recovery

Solana is trading at $79 as of Friday, following a correction of over 9% so far this week. On-chain and derivatives data indicates mixed sentiment among traders, further limiting the chances of a price recovery.

A tale of two labour markets: Headline strength masks underlying weakness

Undoubtedly, yesterday’s delayed US January jobs report delivered a strong headline – one that surpassed most estimates. However, optimism quickly faded amid sobering benchmark revisions.

Solana Price Forecast: Mixed market sentiment caps recovery

Solana (SOL) is trading at $79 as of Friday, following a correction of over 9% so far this week. On-chain and derivatives data indicates mixed sentiment among traders, further limiting the chances of a price recovery.