|

USD/INR technical analysis: Greenback failed breakout above 71.90 against Indian rupee

  •  USD/INR fails to break above the 71.90 resistance.
  • USD/INR is set to remain trapped in a tight range in the medium term.
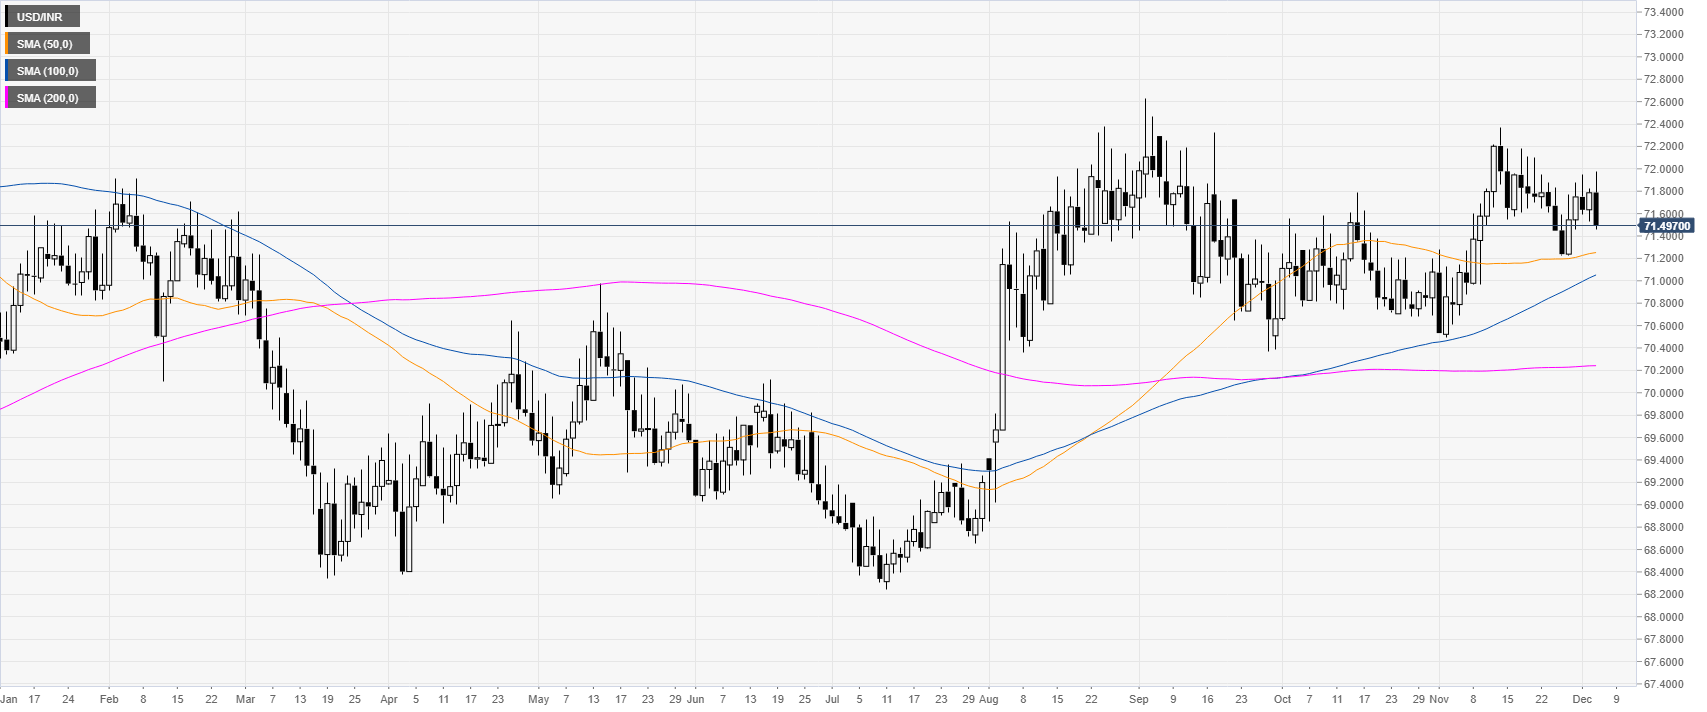
 

USD/INR daily chart

 
USD/INR is trading in a bull trend above its main daily simple moving averages (DMAs). The market formed a bull flag in November and now the price is consolidating above the 71.20 swing low.
 

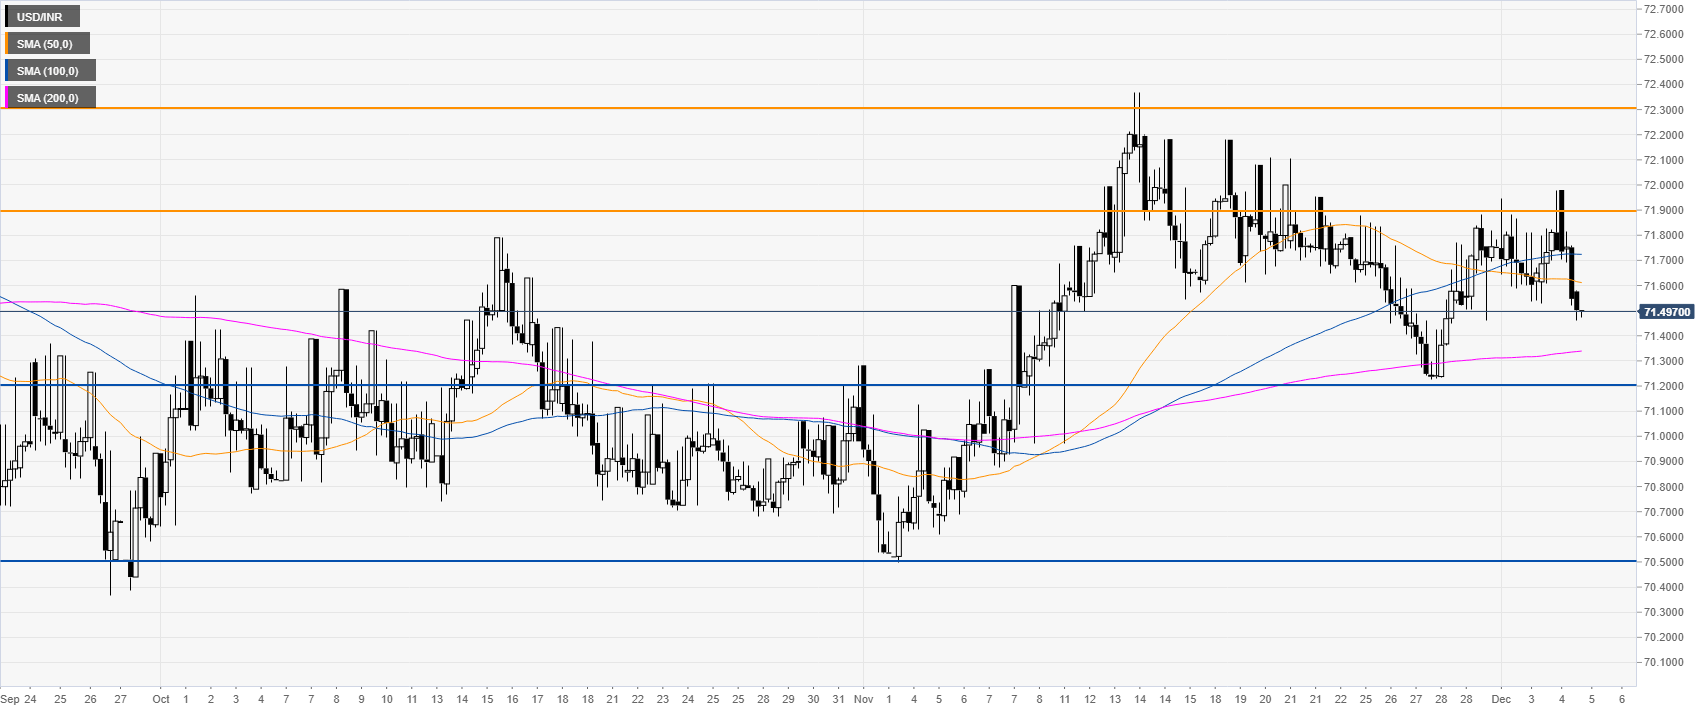
USD/INR four-hour chart

 
The break above the 71.90 resistance failed as the bears rejected the price quite strongly. The market seems to trapped in the 7120-71.90 range in the medium term.

Additional key levels

USD/INR

Overview
Today last price71.502
Today Daily Change-0.2840
Today Daily Change %-0.40
Today daily open71.786
 
Trends
Daily SMA2071.6394
Daily SMA5071.2426
Daily SMA10071.0251
Daily SMA20070.2405
 
Levels
Previous Daily High71.826
Previous Daily Low71.5275
Previous Weekly High71.8815
Previous Weekly Low71.2255
Previous Monthly High72.37
Previous Monthly Low70.4975
Daily Fibonacci 38.2%71.712
Daily Fibonacci 61.8%71.6415
Daily Pivot Point S171.6003
Daily Pivot Point S271.4147
Daily Pivot Point S371.3018
Daily Pivot Point R171.8988
Daily Pivot Point R272.0117
Daily Pivot Point R372.1973

Author

Flavio Tosti

Flavio Tosti

Independent Analyst


More from Flavio Tosti
Share:

Editor's Picks

EUR/USD treads water above 1.1850 amid thin trading

EUR/USD stays defensive but holds 1.1850 amid quiet markets in the European hours on Monday.  The US Dollar is struggling for direction due to thin liquidity conditions as US markets are closed in observance of Presidents' Day. 

GBP/USD flat lines as traders await key UK and US macro data

GBP/USD kicks off a new week on a subdued note and oscillates in a narrow range near 1.365 in Monday's European trading. The mixed fundamental backdrop warrants some caution for aggressive traders as the market focus now shifts to this week's important releases from the UK and the US.

Gold slides below $5,000 amid USD uptick and positive risk tone; downside seems limited

Gold attracts fresh sellers at the start of a new week and reverses a part of Friday's strong move up of over $150 from sub-$4,900 levels. The commodity slides back below the $5,000 psychological mark during the Asian session, though the downside potential seems limited amid a combination of supporting factors.

Bitcoin, Ethereum and Ripple consolidate within key ranges as selling pressure eases

Bitcoin and Ethereum prices have been trading sideways within key ranges following the massive correction. Meanwhile, XRP recovers slightly, breaking above the key resistance zone. The top three cryptocurrencies hint at a potential short-term recovery, with momentum indicators showing fading bearish signs.

Global inflation watch: Signs of cooling services inflation

Realized inflation landed close to expectations in January, as negative base effects weighed on the annual rates. Remaining sticky inflation is largely explained by services, while tariff-driven goods inflation remains limited even in the US.

Ripple Price Forecast: XRP potential bottom could be in sight

Ripple edges up above the intraday low of $1.35 at the time of writing on Friday amid mixed price actions across the crypto market. The remittance token failed to hold support at $1.40 the previous day, reflecting risk-off sentiment amid a decline in retail and institutional sentiment.