USD/INR Technical Analysis: 72.00 ahead?
- The USD/INR pair is currently trading at 71.31, having clocked a 20-day high of 71.4375 a few minutes ago.
- A descending triangle breakout and the inverse head-and-shoulders bullish reversal seen in the 4-hour chart indicates the pullback from the record highs above 74.00 has likely ended at 69.57 and the dollar bulls have regained control.
- The inverse head-and-shoulders breakout, in particular, indicates scope for a rally to 72.50 (target as per the measured move method). Backing the bullish breakout are the ascending 5- and 10-day moving averages (MAs).
- The bullish case, however, would weaken if the pair finds acceptance under the former resistance-turned-support of 71.16.

4-hour chart
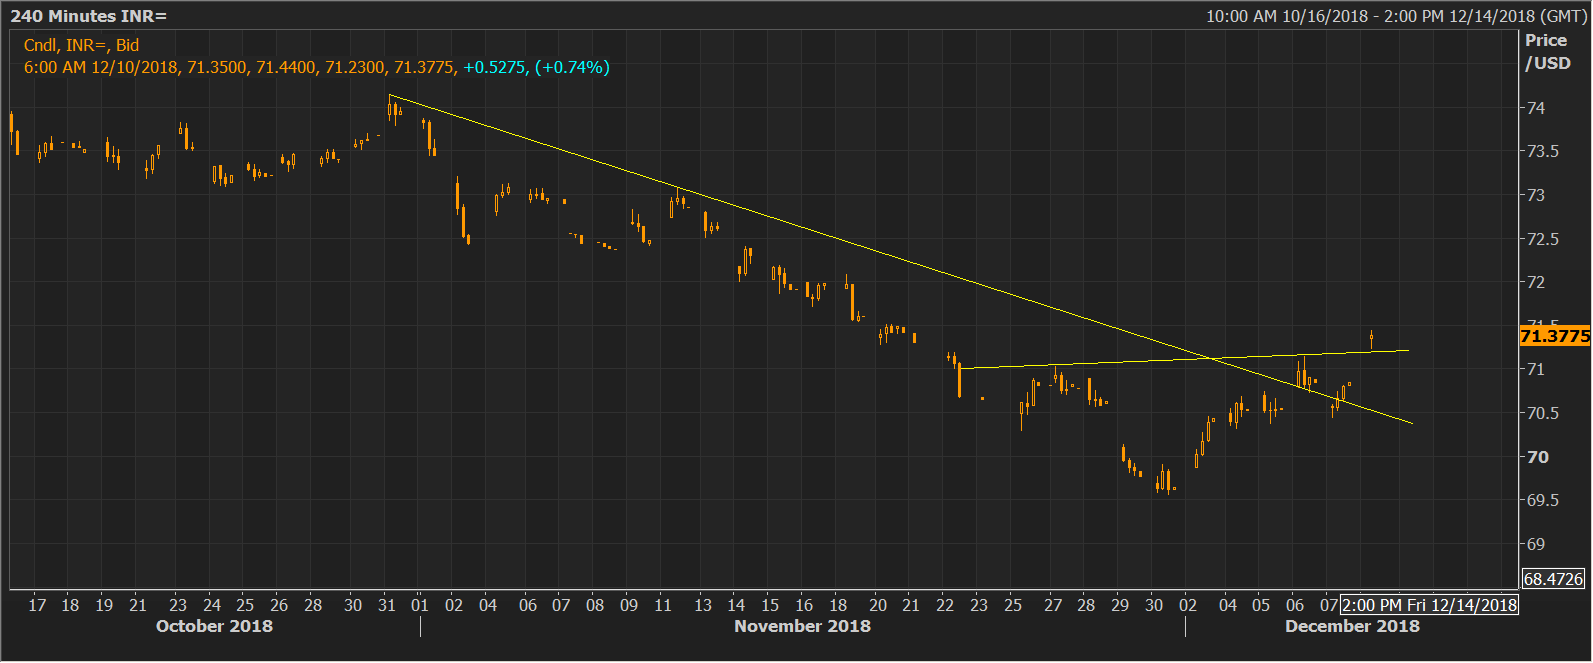
Trend: Bullish
USD/INR
Overview:
Today Last Price: 71.355
Today Daily change: -4.5e+2 pips
Today Daily change %: -0.0630%
Today Daily Open: 71.4
Trends:
Previous Daily SMA20: 71.1046
Previous Daily SMA50: 72.5084
Previous Daily SMA100: 71.5198
Previous Daily SMA200: 69.1907
Levels:
Previous Daily High: 71.44
Previous Daily Low: 70.415
Previous Weekly High: 71.44
Previous Weekly Low: 69.6505
Previous Monthly High: 74.09
Previous Monthly Low: 69.5705
Previous Daily Fibonacci 38.2%: 71.0484
Previous Daily Fibonacci 61.8%: 70.8066
Previous Daily Pivot Point S1: 70.73
Previous Daily Pivot Point S2: 70.06
Previous Daily Pivot Point S3: 69.705
Previous Daily Pivot Point R1: 71.755
Previous Daily Pivot Point R2: 72.11
Previous Daily Pivot Point R3: 72.78
Author

Omkar Godbole
FXStreet Contributor
Omkar Godbole, editor and analyst, joined FXStreet after four years as a research analyst at several Indian brokerage companies.


