|

USD/INR Technical Analysis: 100-day MA is again reversing the bounce

USD/INR is currently trading at 71.00, having failed to take out the 100-day moving average (MA)  in the previous two days. 

Daily chart

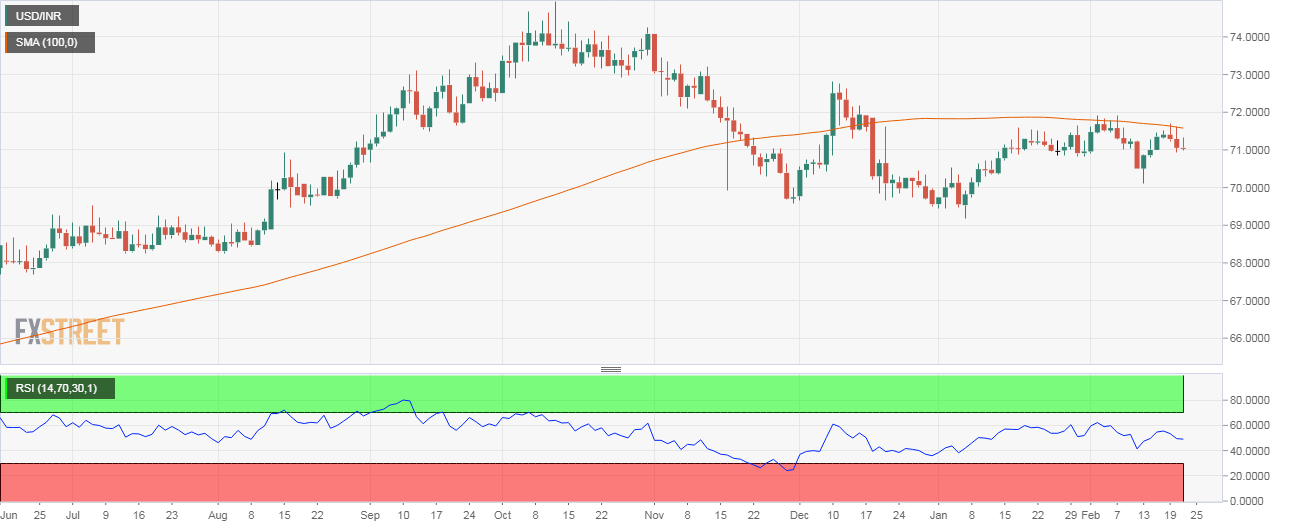
As seen above, the rally from Jan. 7 low of 69.185 ran out of steam at 100-day MA earlier this month and the repeated bull failure there was followed by a drop to 70.10 on Feb. 13. 

The average is again proving a tough nut to crack. As noted earlier, the pair failed to close above the 100-day MA in the previous two days and is now feeling the pull of gravity. 

The support at 70.50 could again come into play if the rejection at the 100-day MA fuels a break below the immediate support near 70.80. 

A daily close above the 100-day MA is needed to strengthen the bull grip. 

Trend: Bullish above 100-day MA

    1. R3 72.134
    2. R2 71.872
    3. R1 71.4635
  1. PP 71.2015
    1. S1 70.793
    2. S2 70.531
    3. S3 70.1225

Author

Omkar Godbole

Omkar Godbole

FXStreet Contributor

Omkar Godbole, editor and analyst, joined FXStreet after four years as a research analyst at several Indian brokerage companies.

More from Omkar Godbole
Share:

Editor's Picks

EUR/USD recedes to daily lows near 1.1850

EUR/USD keeps its bearish momentum well in place, slipping back to the area of 1.1850 to hit daily lows on Monday. The pair’s continuation of the leg lower comes amid decent gains in the US Dollar in a context of scarce volatility and thin trade conditions due to the inactivity in the US markets.

GBP/USD resumes the downtrend, back to the low-1.3600s

GBP/USD rapidly leaves behind Friday’s decent advance, refocusing on the downside and retreating to the 1.3630 region at the beginning of the week. In the meantime, the British Pound is expected to remain under the microscope ahead of the release of the key UK labour market report on Tuesday.

Gold looks inconclusive around $5,000

Gold partially fades Friday’s strong recovery, orbiting around the key $5,000 region per troy ounce in a context of humble gains in the Greenback on Monday. Additing to the vacillating mood, trade conditions remain thin amid the observance of the Presidents Day holiday in the US.

Bitcoin consolidates as on-chain data show mixed signals

Bitcoin price has consolidated between $65,700 and $72,000 over the past nine days, with no clear directional bias. US-listed spot ETFs recorded a $359.91 million weekly outflow, marking the fourth consecutive week of withdrawals.

The week ahead: Key inflation readings and why the AI trade could be overdone

It is likely to be a quiet start to the week, with US markets closed on Monday for Presidents Day. European markets are higher across the board and gold is clinging to the $5,000 level after the tamer than expected CPI report in the US reduced haven flows to precious metals.

Monero Price Forecast: XMR risks a drop below $300 under mounting bearish pressure

Monero (XMR) starts the week under pressure, recording a 4% decline at press time on Monday after a 7% drop the previous day, putting the $300 support zone in focus.