USD/INR strengthens ahead of US NFP data
- The Indian Rupee loses traction in Friday’s early European session.
- Higher crude oil prices and persistent local US Dollar (USD) demand weigh on the INR.
- Investors await the US June employment data on Friday for fresh impetus.

The Indian Rupee (INR) weakens on Friday amid elevated crude oil prices and local US Dollar (USD) demand. Pressure on the Japanese Yen and Chinese Yuan had put Asian peers on the defensive in previous trading sessions, but the recent discouraging US economic data helped to alleviate the INR’s depreciation.
Market players will closely monitor the US June employment data on Friday, including Nonfarm Payrolls, Unemployment Rate, and Average Hourly Earnings. These figures might offer some hints about the Federal Reserve’s (Fed) policy rates trajectory. In the case of the weaker-than-expected reading, this could fuel the Fed rate cut expectation, which exerts some selling pressure on the Greenback.
Daily Digest Market Movers: Indian Rupee remains vulnerable amid global headwinds
- The outlook for India’s stock market performance in the coming decade is bright, buoyed by optimism about the country’s economic prospects after last month’s general election results, according to analysts citing WSJ.
- India’s statistics ministry last week raised its GDP growth forecast to 7.6% in its second revised estimate, up from 7.3% in the first advance forecast.
- The Fed officials emphasized the data-dependent approach and refrained from committing to interest rate cuts until further observation. Several policymakers stated that it’s necessary to hike again if inflation were to rebound, according to the Minutes of the FOMC meeting on June 11-12.
- Traders are now pricing in nearly 70% odds for a 25 basis points (bps) Fed rate cut in September, up from 58.2% last Friday, according to the CME FedWatch Tool.
- The US Nonfarm Payrolls is expected to show 190K jobs added in June, below the previous reading of 272K. The Unemployment Rate is projected to remain unchanged at 4%. Finally, the Average Hourly Earnings are forecast to drop to 3.9% YoY in June from 4.1% in May.
- “A weaker labour market from here could bring the Fed into play – this, therefore, puts additional weight on the unemployment rate, which is part of Friday’s US payrolls report,” said Chris Weston, head research at broker Pepperstone.
Technical analysis: USD/INR remains capped in a familiar range in the near term
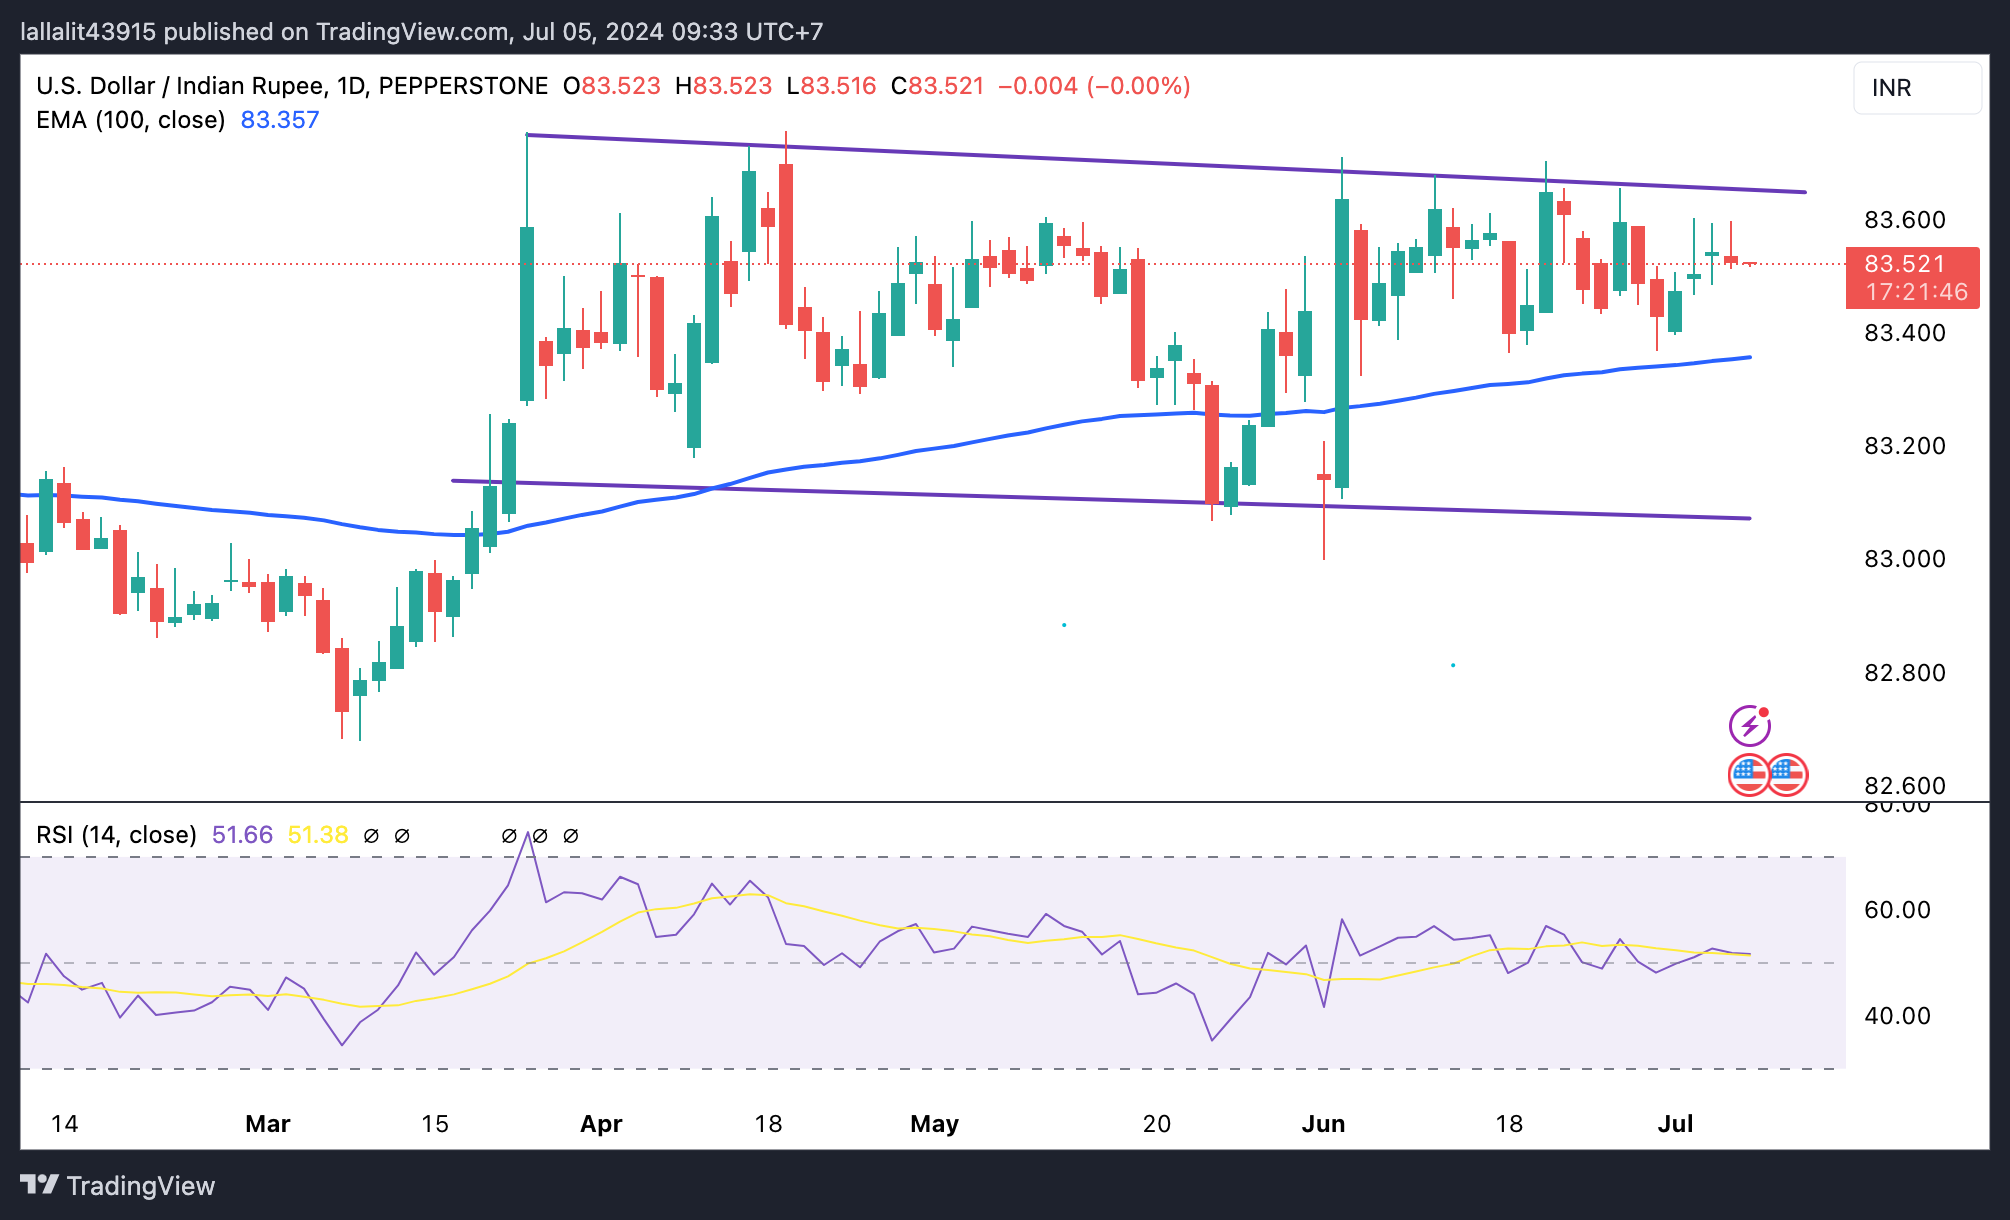
The Indian Rupee trades on a weaker note on the day. The USD/INR pair keeps the bullish vibe on the daily timeframe as it holds above the key 100-day Exponential Moving Average (EMA).
However, in the near term, USD/INR has oscillated within the familiar trading range for a couple of months already. The 14-day Relative Strength Index (RSI) hovers around the 50-midline, suggesting that further consolidation is in play.
If USD strength picks up, the first bullish target will emerge at 83.65, a high of June 26. Sustained upside momentum could lift the pair up to the all-time high of 83.75 en route to the 84.00 psychological mark.
On the other hand, the initial support level for USD/INR is seen at 83.35, the 100-day EMA. Any follow-through selling could drag the pair back down to the 83.00 round figure, followed by 82.82, a low of January 12.
US Dollar price today
The table below shows the percentage change of US Dollar (USD) against listed major currencies today. US Dollar was the strongest against the New Zealand Dollar.
| USD | EUR | GBP | CAD | AUD | JPY | NZD | CHF | |
| USD | -0.09% | -0.08% | -0.04% | -0.08% | -0.39% | -0.04% | -0.16% | |
| EUR | 0.10% | 0.01% | 0.06% | 0.03% | -0.29% | 0.04% | -0.06% | |
| GBP | 0.09% | -0.01% | 0.06% | 0.02% | -0.30% | 0.04% | -0.06% | |
| CAD | 0.04% | -0.06% | -0.04% | -0.03% | -0.35% | -0.01% | -0.11% | |
| AUD | 0.08% | -0.02% | 0.00% | 0.02% | -0.32% | 0.02% | -0.11% | |
| JPY | 0.38% | 0.30% | 0.31% | 0.35% | 0.33% | 0.34% | 0.23% | |
| NZD | 0.04% | -0.05% | -0.04% | 0.01% | -0.03% | -0.35% | -0.12% | |
| CHF | 0.16% | 0.05% | 0.07% | 0.13% | 0.11% | -0.24% | 0.10% |
The heat map shows percentage changes of major currencies against each other. The base currency is picked from the left column, while the quote currency is picked from the top row. For example, if you pick the Euro from the left column and move along the horizontal line to the Japanese Yen, the percentage change displayed in the box will represent EUR (base)/JPY (quote).
Indian Rupee FAQs
The Indian Rupee (INR) is one of the most sensitive currencies to external factors. The price of Crude Oil (the country is highly dependent on imported Oil), the value of the US Dollar – most trade is conducted in USD – and the level of foreign investment, are all influential. Direct intervention by the Reserve Bank of India (RBI) in FX markets to keep the exchange rate stable, as well as the level of interest rates set by the RBI, are further major influencing factors on the Rupee.
The Reserve Bank of India (RBI) actively intervenes in forex markets to maintain a stable exchange rate, to help facilitate trade. In addition, the RBI tries to maintain the inflation rate at its 4% target by adjusting interest rates. Higher interest rates usually strengthen the Rupee. This is due to the role of the ‘carry trade’ in which investors borrow in countries with lower interest rates so as to place their money in countries’ offering relatively higher interest rates and profit from the difference.
Macroeconomic factors that influence the value of the Rupee include inflation, interest rates, the economic growth rate (GDP), the balance of trade, and inflows from foreign investment. A higher growth rate can lead to more overseas investment, pushing up demand for the Rupee. A less negative balance of trade will eventually lead to a stronger Rupee. Higher interest rates, especially real rates (interest rates less inflation) are also positive for the Rupee. A risk-on environment can lead to greater inflows of Foreign Direct and Indirect Investment (FDI and FII), which also benefit the Rupee.
Higher inflation, particularly, if it is comparatively higher than India’s peers, is generally negative for the currency as it reflects devaluation through oversupply. Inflation also increases the cost of exports, leading to more Rupees being sold to purchase foreign imports, which is Rupee-negative. At the same time, higher inflation usually leads to the Reserve Bank of India (RBI) raising interest rates and this can be positive for the Rupee, due to increased demand from international investors. The opposite effect is true of lower inflation.
Author

Lallalit Srijandorn
FXStreet
Lallalit Srijandorn is a Parisian at heart. She has lived in France since 2019 and now becomes a digital entrepreneur based in Paris and Bangkok.


