USD/INR trims losses amid India’s election uncertainty
- Indian Rupee struggles to gain ground on Tuesday.
- The concerns surrounding India’s upcoming election created a tailwind for USD/INR.
- Traders await India’s Q4 GDP and US PCE inflation data, which are due on Friday.

Indian Rupee (INR) trades in negative territory on Tuesday, despite the softer US dollar (USD). Speculative flows have slowed as investors are hesitant to place large bets and await the outcome of India's general elections on June 4. Furthermore, the rise in crude oil exerts some selling pressure on the INR as India is the world's third-biggest oil importer and consumer.
Investors will closely monitor the release of India’s Gross Domestic Product (GDP) for the fourth quarter of 2023 on Friday, which is estimated to moderate to 6.7% in Q4 from the previous reading of 8.4%. In case of weaker-than-expected growth, this could exert some pressure on the Indian Rupee. On the US docket, the final reading of the Personal Consumption Expenditures Price Index (PCE) for April will be in the spotlight on Friday. The hotter-than-expected PCE inflation data could lower the expectation of Fed rate cuts and boost the Greenback.
Daily Digest Market Movers: Indian Rupee edges lower due to uncertainties and higher oil prices
- Indian equity indices registered strong gains, with BSE Sensex and Nifty 50 hitting fresh record highs but ended the session in the red.
- Despite negative foreign fund flows in most emerging markets, India continues to attract large investments, owing to strong ETF inflows and positive investor sentiment, according to research by Kotak Institutional Equities (KIE).
- India's economy is likely to grow at its slowest pace in a year in the first quarter due to weak demand, according to a Reuters poll.
- Gazan officials said on Monday that an Israeli airstrike triggered a fire that killed 45 people in a tent camp in the Gazan city of Rafah. Global leaders called for the implementation of a World Court order to halt Israel's attacks, per Reuters.
- Investors are now pricing in 34 basis points (bps) of the Federal Reserve (Fed) rate cut over 2024, down from nearly 50 bps of cuts expected earlier this month.
- The US Core Personal Consumption Expenditures Price Index (Core PCE), is estimated to show an increase of 0.3% MoM and 2.8% YoY in April.
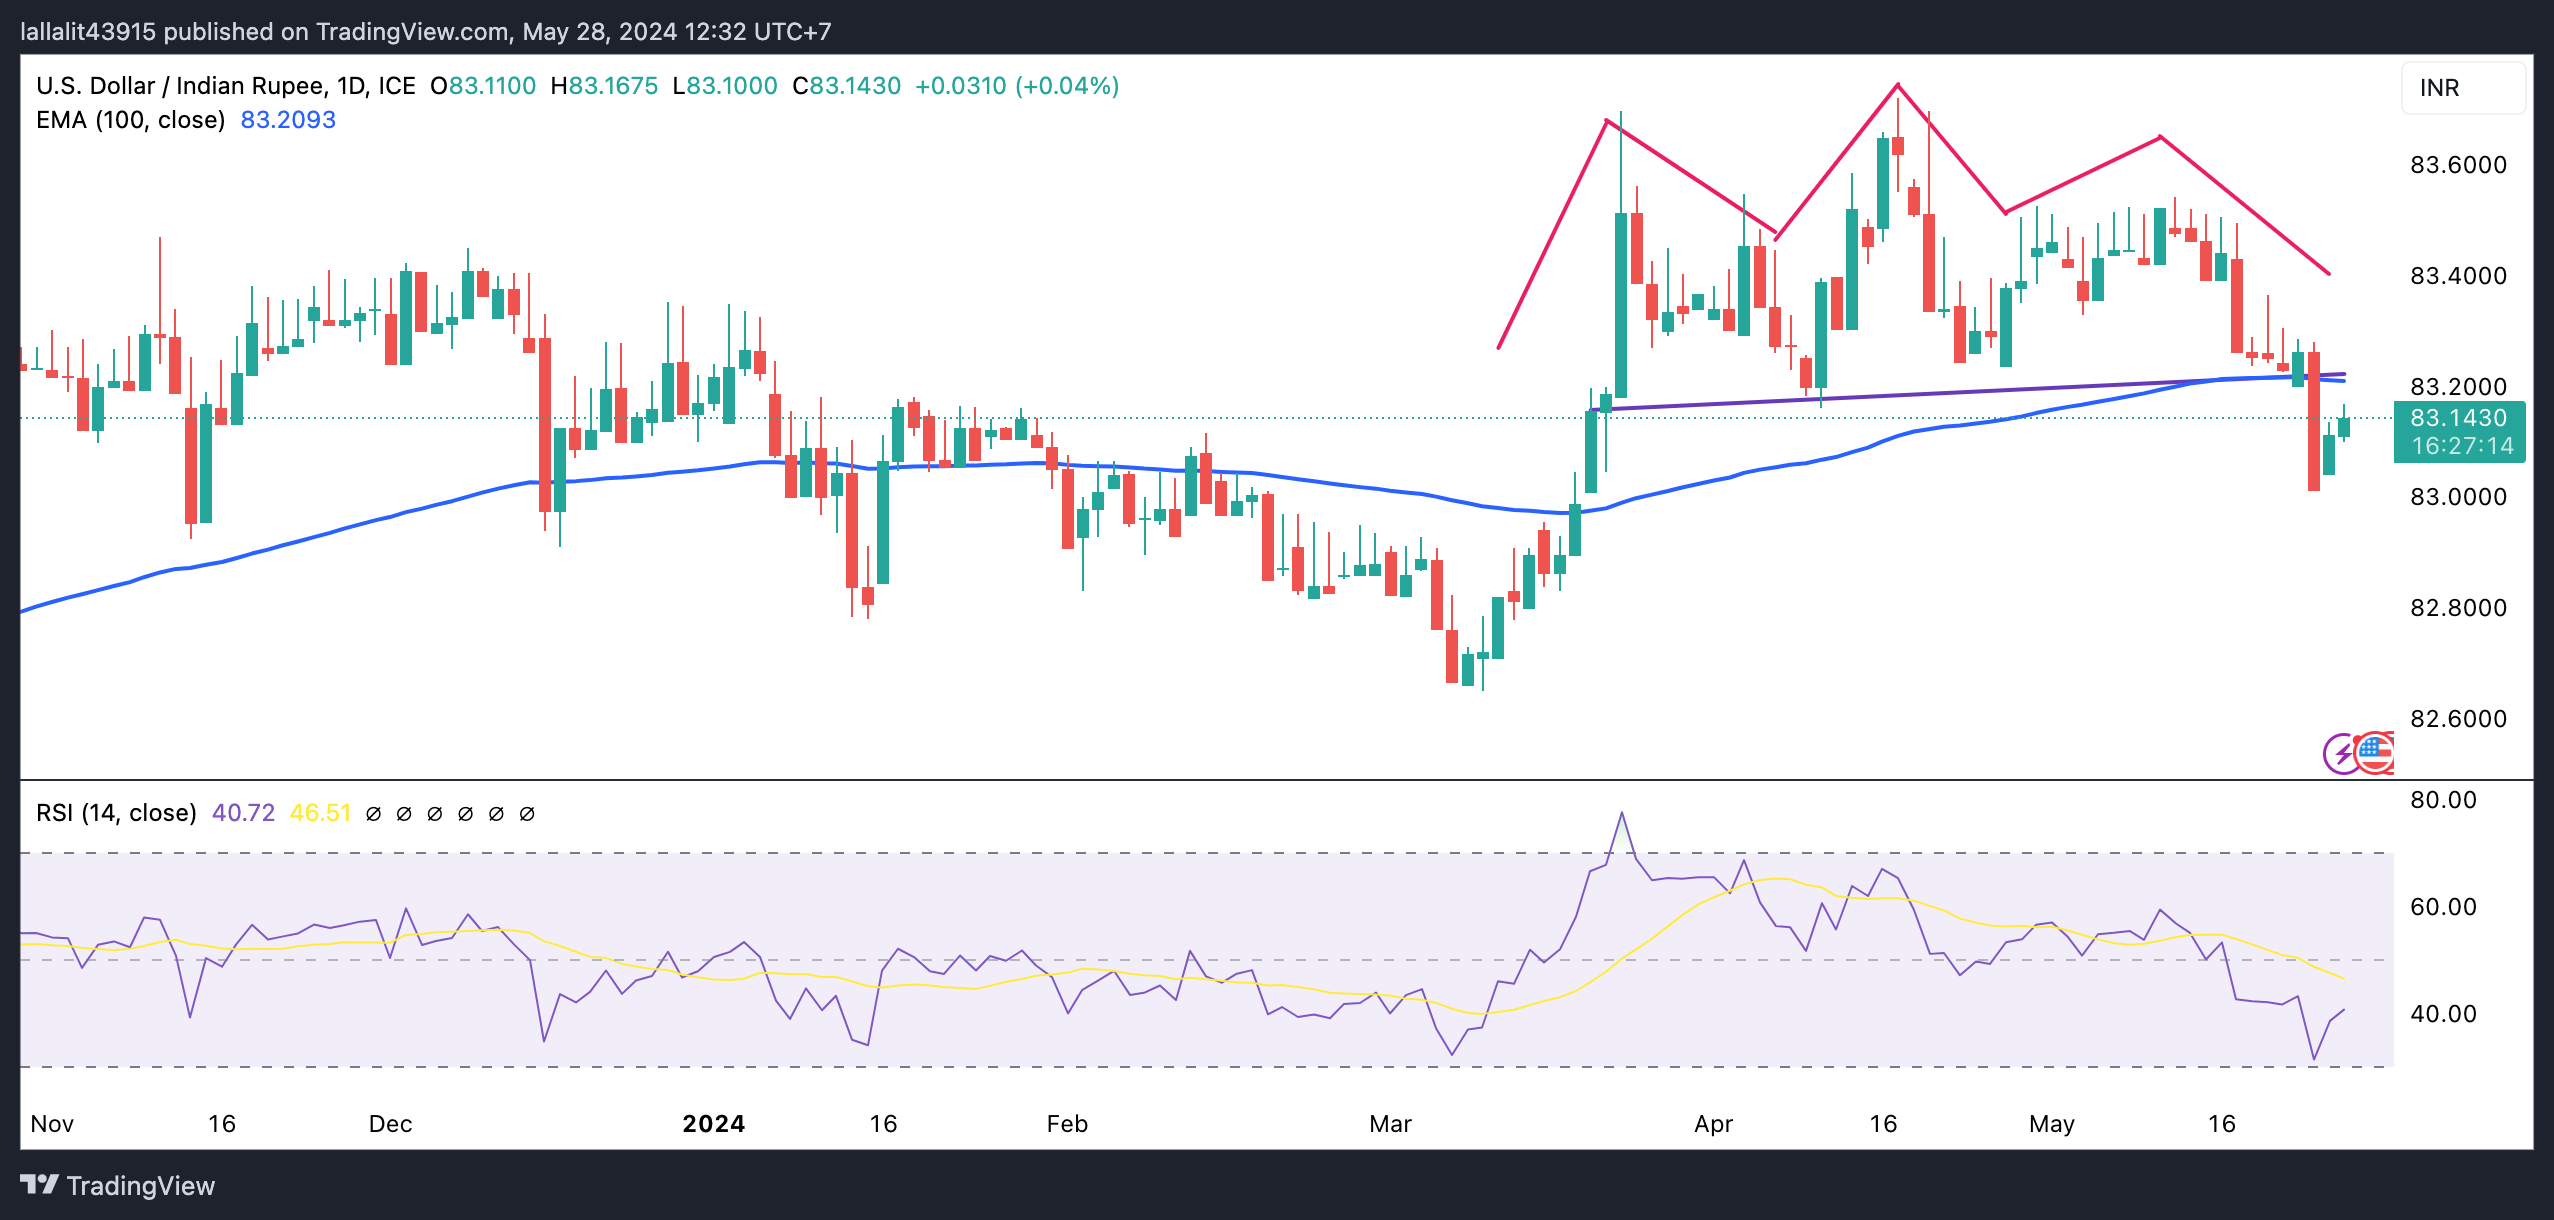
Technical analysis: USD/INR turns bearish on the daily chart
The Indian Rupee trades softer on the day. The USD/INR pair resumes a bearish outlook after breaking below the neckline of the Head and Shoulders pattern last week. The path of least resistance is to the downside as the pair holds below the key 100-day Exponential Moving Average (EMA) on the daily chart, and the 14-day Relative Strength Index (RSI) stands in bearish territory around 37.80.
The potential upside barrier for USD/INR will emerge near the support-turned-resistance level and the 100-day EMA at 83.20. Sustained rallies could expose a high of May 13 at 83.54 en route to a high of April 17 at 83.72, and then the 84.00 psychological level.
On the downside, a decisive break below the 83.00 round mark could drag the pair to the next downside target near a low of January 15 at 82.78. The additional downside filter to watch is a low of March 11 at 82.65.
US Dollar price in the last 7 days
The table below shows the percentage change of US Dollar (USD) against listed major currencies in the last 7 days. US Dollar was the strongest against the Japanese Yen.
| USD | EUR | GBP | CAD | AUD | JPY | NZD | CHF | |
| USD | -0.15% | -0.49% | 0.02% | 0.17% | 0.32% | -0.84% | 0.19% | |
| EUR | 0.15% | -0.35% | 0.15% | 0.31% | 0.44% | -0.70% | 0.34% | |
| GBP | 0.49% | 0.35% | 0.51% | 0.65% | 0.79% | -0.35% | 0.69% | |
| CAD | -0.01% | -0.16% | -0.51% | 0.15% | 0.28% | -0.85% | 0.19% | |
| AUD | -0.19% | -0.34% | -0.68% | -0.17% | 0.13% | -1.03% | 0.00% | |
| JPY | -0.32% | -0.44% | -0.78% | -0.29% | -0.11% | -1.14% | -0.10% | |
| NZD | 0.81% | 0.67% | 0.34% | 0.84% | 0.98% | 1.13% | 1.02% | |
| CHF | -0.22% | -0.37% | -0.70% | -0.20% | -0.03% | 0.10% | -1.06% |
The heat map shows percentage changes of major currencies against each other. The base currency is picked from the left column, while the quote currency is picked from the top row. For example, if you pick the Euro from the left column and move along the horizontal line to the Japanese Yen, the percentage change displayed in the box will represent EUR (base)/JPY (quote).
RBI FAQs
The role of the Reserve Bank of India (RBI), in its own words, is '..to maintain price stability while keeping in mind the objective of growth.” This involves maintaining the inflation rate at a stable 4% level primarily using the tool of interest rates. The RBI also maintains the exchange rate at a level that will not cause excess volatility and problems for exporters and importers, since India’s economy is heavily reliant on foreign trade, especially Oil.
The RBI formally meets at six bi-monthly meetings a year to discuss its monetary policy and, if necessary, adjust interest rates. When inflation is too high (above its 4% target), the RBI will normally raise interest rates to deter borrowing and spending, which can support the Rupee (INR). If inflation falls too far below target, the RBI might cut rates to encourage more lending, which can be negative for INR.
Due to the importance of trade to the economy, the Reserve Bank of India (RBI) actively intervenes in FX markets to maintain the exchange rate within a limited range. It does this to ensure Indian importers and exporters are not exposed to unnecessary currency risk during periods of FX volatility. The RBI buys and sells Rupees in the spot market at key levels, and uses derivatives to hedge its positions.
Author

Lallalit Srijandorn
FXStreet
Lallalit Srijandorn is a Parisian at heart. She has lived in France since 2019 and now becomes a digital entrepreneur based in Paris and Bangkok.


