|

USD Index Price Analysis: There is an initial resistance around 107.00

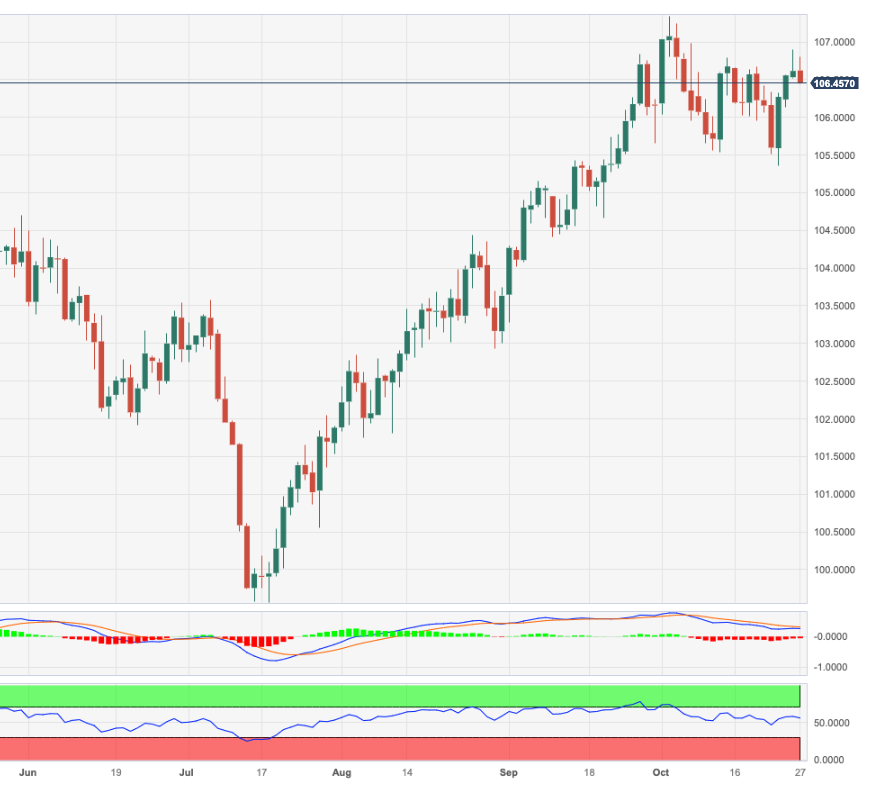
-  DXY now comes under some downside pressure near 106.50.

-  Occasional bullish attempts should meet the next hurdle near 107.00.


DXY sees its recent upside momentum somewhat trimmed and revisits the mid-106.00s at the end of the week.

If the index breaks above the weekly top at 106.89 (October 26), it could then target the round level of 107.00 prior to the 2023 high of 107.34 (October 3).

So far, while above the key 200-day SMA, today at 103.39, the outlook for the index is expected to remain constructive.

DXY daily chart

Dollar Index Spot

Overview
Today last price106.56
Today Daily Change37
Today Daily Change %-0.06
Today daily open106.62
 
Trends
Daily SMA20106.34
Daily SMA50105.34
Daily SMA100103.77
Daily SMA200103.38
 
Levels
Previous Daily High106.89
Previous Daily Low106.52
Previous Weekly High106.67
Previous Weekly Low105.96
Previous Monthly High106.84
Previous Monthly Low103.27
Daily Fibonacci 38.2%106.75
Daily Fibonacci 61.8%106.66
Daily Pivot Point S1106.46
Daily Pivot Point S2106.3
Daily Pivot Point S3106.08
Daily Pivot Point R1106.83
Daily Pivot Point R2107.05
Daily Pivot Point R3107.21

Author

Pablo Piovano

Born and bred in Argentina, Pablo has been carrying on with his passion for FX markets and trading since his first college years.

More from Pablo Piovano
Share:

Markets move fast. We move first.

Orange Juice Newsletter brings you expert driven insights - not headlines. Every day on your inbox.

By subscribing you agree to our Terms and conditions.

Editor's Picks

EUR/USD could test 1.1750 amid strengthening bullish bias

EUR/USD remains flat after two days of small losses, trading around 1.1740 during the Asian hours on Thursday. On the daily chart, technical analysis indicates a strengthening of a bullish bias, as the pair continues to trade within an ascending channel pattern.

GBP/USD consolidates above mid-1.3300s as traders await BoE and US CPI report

The GBP/USD pair struggles to capitalize on the overnight bounce from the 1.3310 area, or a one-week low, and oscillates in a narrow band during the Asian session on Thursday. Spot prices currently trade around the 1.3370 region, down less than 0.10% for the day, as traders opt to wait on the sidelines ahead of the key central bank event risk and US consumer inflation data.

Gold awaits weekly trading range breakout ahead of US CPI report

Gold struggles to capitalize on the previous day's move higher back closer to the $4,350 level and trades with a mild negative bias during the Asian session on Thursday. The downtick could be attributed to some profit-taking amid a US Dollar uptick, though it is likely to remain cushioned on the back of a supportive fundamental backdrop. 

Dogecoin breaks key support amid declining investor confidence

Dogecoin trades in the red on Thursday, following a 4% decline on the previous day. The DOGE supply in profit declines as large wallet investors trim their portfolios. Derivatives data shows a surge in bearish positions amid declining retail interest.

Monetary policy: Three central banks, three decisions, the same caution

While the Fed eased its monetary policy on 10 December for the third consecutive FOMC meeting, without making any guarantees about future action, the BoE, the ECB and the BoJ are holding their respective meetings this week. 

Dogecoin Price Forecast: DOGE breaks key support amid declining investor confidence

Dogecoin (DOGE) trades in the red on Thursday, following a 4% decline on the previous day. The DOGE supply in profit declines as large wallet investors trim their portfolios. Derivatives data shows a surge in bearish positions amid declining retail interest.