USD/IDR Price Analysis: Indonesian rupiah set to trim gains
- USD/IDR funnels down to the break of key 14,680-14,725 area.
- Oversold RSI, candlestick formation keep buyers hopeful near 14-day low.
- Bears need to refresh monthly low before eyeing the early-March top.

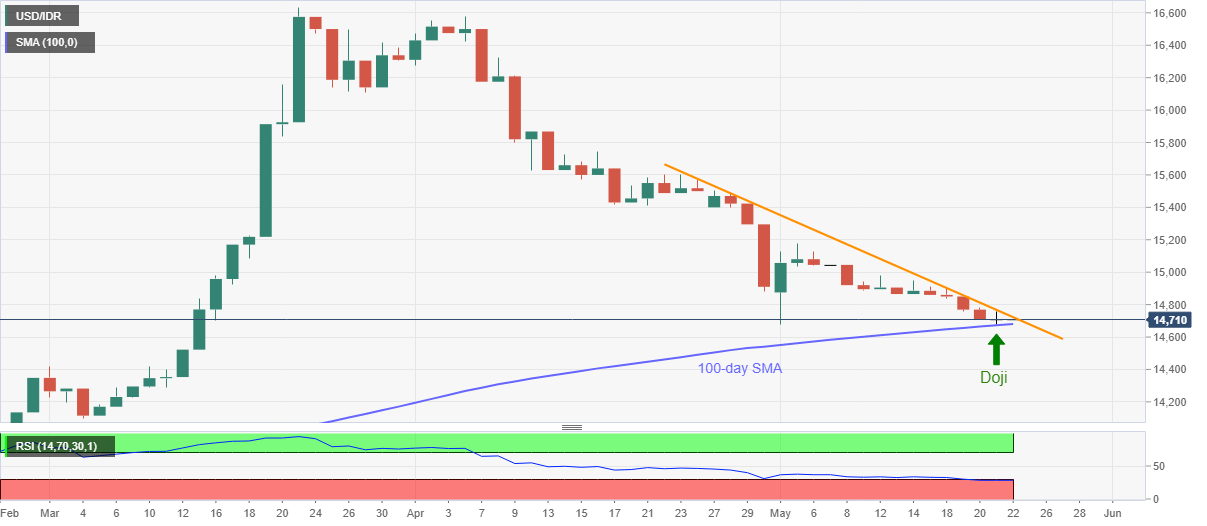
USD/IDR bounces off the early-month low while taking rounds to 14,710 during the initial trading hours on Friday. In doing so, the quote bounces off 100-day SMA while being near to the descending line stretched from April 24.
Considering the oversold RSI conditions, backed by Thursday’s Doji candlestick formation, the pair is likely to recover some of its latest losses on the break of the said resistance line, around 14,725 now.
As a result, buyers can aim for 15,000 round-figure during the fresh rise ahead of targeting to refresh the monthly top of 15,177.
Meanwhile, a daily closing below 100-day SMA level of 14,680 needs validation from the May 04 bottom of 14,678 to challenge March 02 peak surrounding 14,420.
USD/IDR daily chart
Trend: Upside expected
Pivot Table
Author

Anil Panchal
FXStreet
Anil Panchal has nearly 15 years of experience in tracking financial markets. With a keen interest in macroeconomics, Anil aptly tracks global news/updates and stays well-informed about the global financial moves and their implications.