|
USD/CNY Technical Analysis: retraced 78.6 percent of 2016-2018 drop, overbought
- The USD/CNY pair rose above 6.8089 (78.6% Fib retracement of Dec 2016 - March 2018 drop) and looks overbought as per the 14-day relative strength index (RSI).
- The bearish divergence of the hourly chart RSI indicates scope for a minor pullback.

Hourly chart
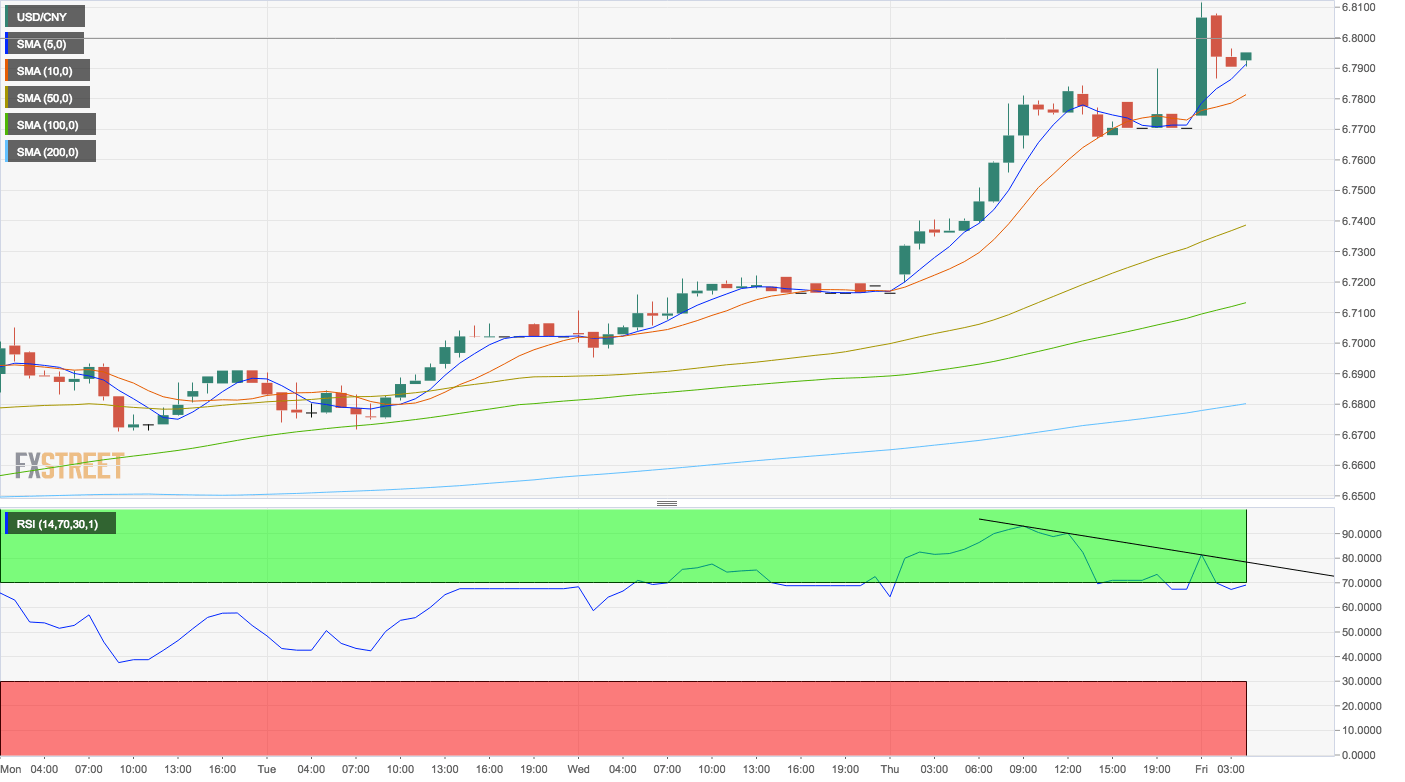
Spot Rate: 6.7906
Daily High: 6.8105
Daily Low: 6.77
Trend: Minor correction likely
R1: 6.8080 (78.6% Fib retracement)
R2: 6.9204 (March 2017 high)
R3: 6.9633 (December 2016 high)
Support
S1: 6.7831 (hourly chart support)
S2: 6.7379 (50-hour moving average)
S3: 6.7122 (100-hour moving average)
Author

Omkar Godbole
FXStreet Contributor
Omkar Godbole, editor and analyst, joined FXStreet after four years as a research analyst at several Indian brokerage companies.
More from Omkar Godbole


