|

USD/CNH Price Analysis: Finds resistance near 7.3600 within an overbought territory

  • USD/CNH may correct downwards as the 14-day RSI indicates an overbought condition.
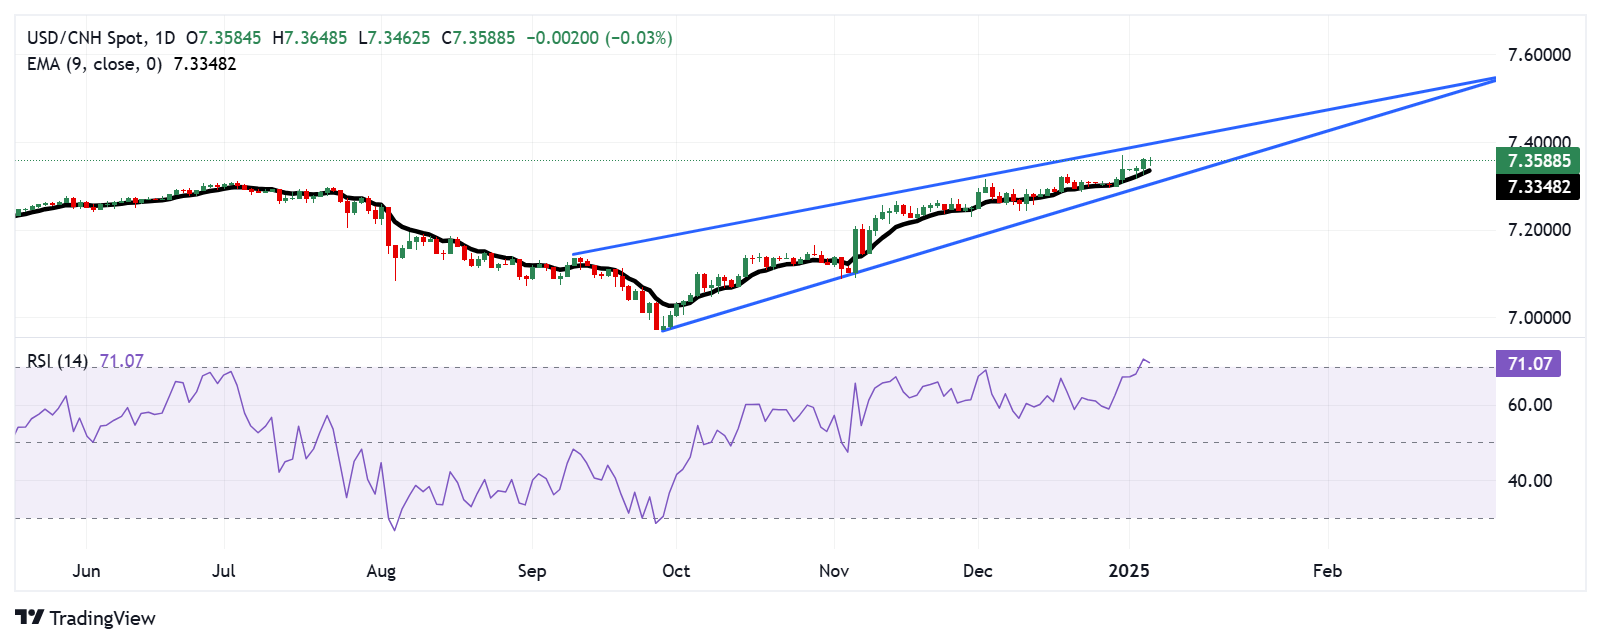
  • The primary barrier appears at the 7.3600, followed by the rising wedge’s upper slope around the 7.4000 level.
  • The pair may test primary support at the nine-day EMA of 7.3346 level.

The USD/CNH pair halts its five-day winning streak, trading around 7.3570 during the Asian hours on Monday. A review of the daily chart suggests that the magnitude of price movement within the rising wedge pattern is decreasing, signaling a pause in the bullish trend.

The 14-day Relative Strength Index (RSI), a crucial momentum indicator, is positioned slightly above the 70 level, indicating an overbought condition and the possibility of a downward correction in the near term.

The USD/CNH pair could find primary resistance at the psychological level of 7.3600 level, followed by the upper slope of the rising wedge around the 7.4000 level. A break above the rising wedge could strengthen the bullish bias and support the pair to continue its rally toward the major level of 7.5000.

On the downside, the USD/CNH pair may initially test the nine-day Exponential Moving Average (EMA) at 7.3346 level, followed by the rising wedge’s lower slope around 7.3070, followed by the psychological level of 7.3000. A break below this level could weaken the bullish momentum and put downward pressure on the pair to approach the next psychological support round 7.2000 level.

USD/CNH: Daily Chart

Author

Akhtar Faruqui

Akhtar Faruqui is a Forex Analyst based in New Delhi, India. With a keen eye for market trends and a passion for dissecting complex financial dynamics, he is dedicated to delivering accurate and insightful Forex news and analysis.

More from Akhtar Faruqui
Share:

Editor's Picks

AUD/USD eyes 0.7150 barrier nine-day EMA

AUD/USD inches higher after registering modest losses in the previous day, trading around 0.7130 during the Asian hours. The technical analysis of the daily chart indicates that the pair is moving sideways within the rectangle pattern, suggesting a consolidation as neither the bulls nor the bears have enough momentum to take control of the market.

USD/JPY trades below 160.00 intervention threshold; bullish bias intact

The USD/JPY pair attracts some sellers during the Asian session amid fears that authorities will step in again to prop up the Japanese Yen. Furthermore, the Israel-Lebanon truce prompts some profit-taking around the US Dollar and exerts downward pressure on the currency pair.

Gold defends 200-day SMA at $4,425, but for how long?

Gold is attempting a tepid recovery toward $4,500 early Thursday, as renewed optimism in the Mideast geopolitical front calms market nerves. This cautious optimism across Asian markets weighs on Oil prices, and diminishes the US Dollar’s safe-haven appeal, helping Gold stage a decent comeback from the weekly low of $4,424.


Hyperliquid: ETF demand, capital rotation fuel HYPE rally as Bitcoin melts

Hyperliquid price sustains an upward trend near its all-time high of $75.76 on Thursday after posting 80% gains in May, while Bitcoin (BTC) retraces below $65,000, triggering a market-wide panic.

Kevin Warsh takes the Fed helm: What it means for the US Dollar
The Federal Reserve moves away from the highly predictable "forward guidance" model of the Jerome Powell era to a new “Kevin Warsh environment”, characterized by less communication, more policy surprises, and an increased focus on the Fed's complex balance sheet.
Recession on paper: What really moves the Canadian Loonie now?

Statistics Canada handed the headline writers a gift and the analysts a headache. Real GDP shrank 0.1% on an annualized basis in the first quarter, and with the fourth quarter of 2025 revised down to a 1.0% contraction, that is two negative quarters in a row, the textbook definition of a technical recession and Canada's first since the pandemic.