|

USD/CNH Price Analysis: At make or a break below 6.80 ahead of US/China Inflation

  • Investors are awaiting US/China inflation data for fresh cues.
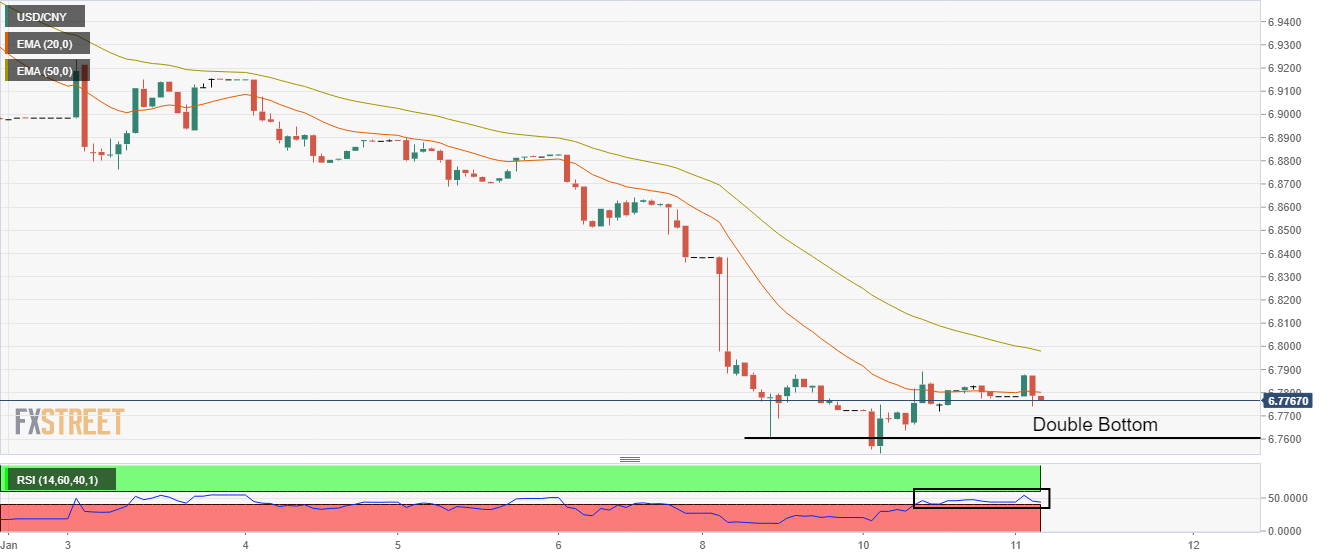
  • The absence of follow-up buying after a Double Bottom formation indicates a lack of strength in the US Dollar.
  • Declining 50-EMA adds to the downside filters.

The USD/CNH pair is struggling to extend its recovery move above the critical resistance of 6.8000 in the Asian session. The asset is demonstrating topsy-turvy moves as investors are awaiting the release of the Consumer Price Index (CPI) figures by the United States and China, which are scheduled for Thursday.

The US Dollar Index (DXY) is hovering near the edge of the 103.00 resistance amid a quiet market mood. Also, S&P500 futures are displaying a subdued performance as anxiety soars ahead of inflation data.

On an hourly scale, the major picked strength after forming a Double Bottom chart pattern that indicates a reversal post sensing weak selling interest on testing of the previous lows around 0.6760. However, the absence of follow-up buying conveys the rebound move as mere a pullback, which can be capitalized by investors for building fresh shorts.

The asset is struggling to shift auction above the 20-period Exponential Moving Average (EMA) at 0.6780, which indicates a lack of strength in the US Dollar. Also, the 50-EMA below 0.6800 is declining, which adds to the downside filters.

Meanwhile, the Relative Strength Index (RSI) (14) is oscillating in a 40.00-60.00 range, which indicates consolidation head.

For an upside move, USD/CNH needs to surpass the 50-EMA at around 6.8000, which will drive the asset toward January 9 high at 6.8292, followed by January 6 high at 6.8926.

On the contrary, a south-side move below Tuesday’s low at 6.7586 will drag the asset toward July 29 low at 6.7282 and round-level support at 6.7000.

USD/CNH hourly chart

USD/CNH

Overview
Today last price6.7866
Today Daily Change0.0008
Today Daily Change %0.01
Today daily open6.7858
 
Trends
Daily SMA206.9391
Daily SMA507.0446
Daily SMA1007.0668
Daily SMA2006.8749
 
Levels
Previous Daily High6.7992
Previous Daily Low6.7588
Previous Weekly High6.9396
Previous Weekly Low6.8236
Previous Monthly High7.0914
Previous Monthly Low6.905
Daily Fibonacci 38.2%6.7838
Daily Fibonacci 61.8%6.7743
Daily Pivot Point S16.7634
Daily Pivot Point S26.7409
Daily Pivot Point S36.723
Daily Pivot Point R16.8038
Daily Pivot Point R26.8217
Daily Pivot Point R36.8442

Author

Sagar Dua

Sagar Dua

FXStreet

Sagar Dua is associated with the financial markets from his college days. Along with pursuing post-graduation in Commerce in 2014, he started his markets training with chart analysis.

More from Sagar Dua
Share:

Editor's Picks

GBP/USD resumes downside below 1.3200

GBP/USD resumes its downside below 1.3200 in European trading on Wednesday. The pair remains vulnerable amid a broadly firmer US Dollar and chaotic UK political environment. The focus is now on BoE-speak for further trading impetus.

EUR/USD sits at yearly low near 1.1350 on USD strength

EUR/USD sits at yearly lows near 1.1350 in the European morning on Wednesday. The pair remains vulnerable to further declines amid a bullish US Dollar. The Greenback continues to draw support from hawkish Fed bets and US-Iran peace deal uncertainty.

Gold: Bears retain control as Fed rate hike bets continue to boost USD

Gold recovers slightly from a nearly two-week low, around the $4,050 region, touched earlier this Wednesday. The commodity, however, sticks to its bearish bias for the second straight day, and seems vulnerable to weaken further amid sustained US Dollar buying.

Dogecoin tests a key make-or-break point amid waning retail support

Dogecoin trades below $0.08000 maintaining a steady decline for the seventh straight week. The meme coin is losing its retail strength as DOGE futures Open Interest drops 10% in 24 hours, while institutional demand remains muted with zero inflows so far this week.

Tech rout weighs on US stocks as the USD clocks a fresh 2026 high

Major US equity benchmarks ended Tuesday’s session considerably in the red, with the Nasdaq 100 down 3.3%, the S&P 500 off by 1.4%, and the Dow Jones down 0.1%. Stocks were largely weighed down by tech amid doubts over the AI-driven rally; the Philadelphia Semiconductor Index slid nearly 8%.

Regime change: Inside Kevin Warsh's first move to make the Fed unreadable on purpose

The rate did not move. That was the least interesting thing about Kevin Warsh's first meeting in charge of the Fed. The FOMC held its benchmark at 3.50%-3.75% for the fourth straight meeting, exactly as priced, and then the new chair used his first press conference to dismantle the machinery the market has leaned on for a decade.