- USD/CNH gains ground near 7.1960 on the cautious mood and downbeat Chinese data.
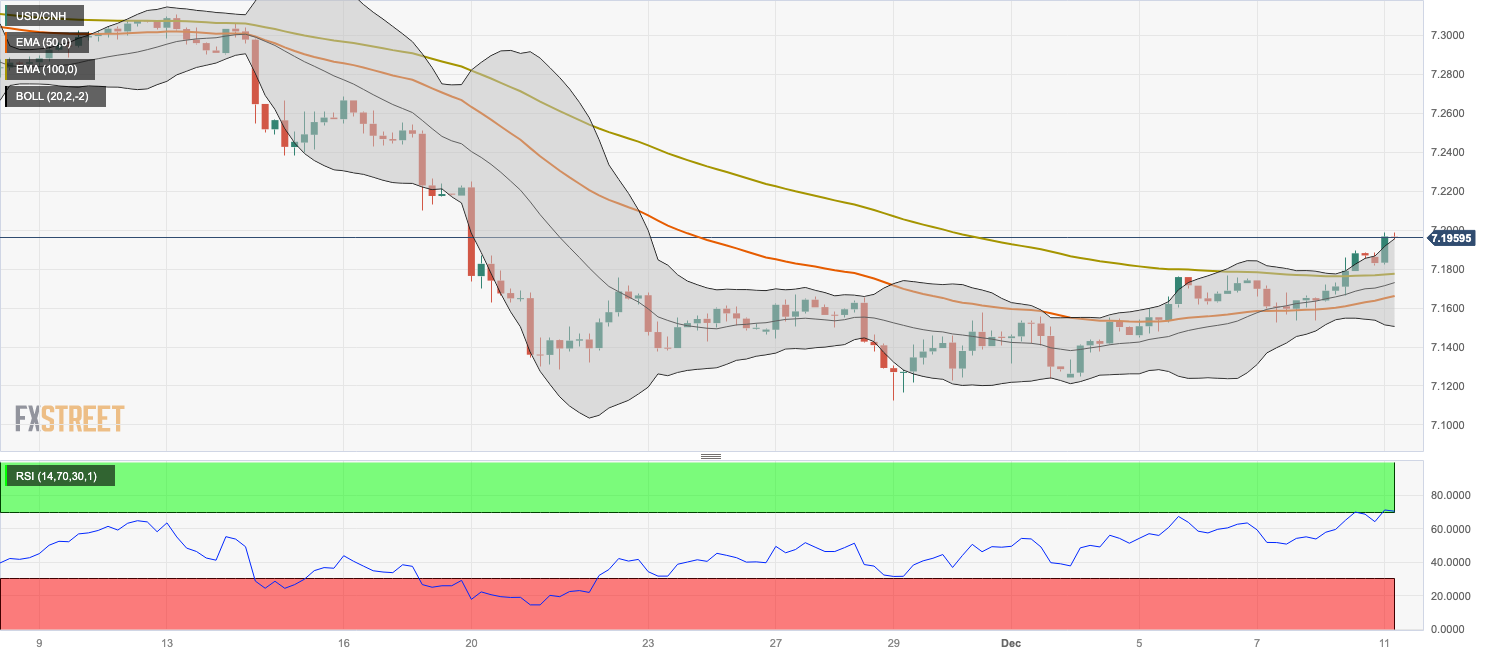
- The pair holds above the 50- and 100-hour EMA; RSI indicator stands in the overbought condition.
- The immediate resistance level is seen at 7.2100; 7.1776 acts as an initial support level for the pair.
The USD/CNH pair holds positive ground around 7.1960 during the Asian session on Monday. The cautious mood in the market and the weaker-than-expected Chinese data lends some support to the pair. Investors await the US inflation data due on Tuesday ahead of the Federal Open Market Committee (FOMC) rate decision on Wednesday for fresh impetus. The markets anticipate the US central bank to hold the rate steady at its December meeting.
Furthermore, the National Bureau of Statistics of China revealed on Saturday that China’s Consumer Price Index (CPI) dropped 0.5% YoY in November from October’s reading 0.2% decline. This figure came in worse than the expectation of a 0.2% decrease. Meanwhile, the nation’s Producer Price Index (PPI) fell 3.0% YoY in November versus a 2.6% decline prior, below the market consensus of a 2.8% decline in the same month.
According to the daily chart, USD/CNH holds above the 50- and 100-hour Exponential Moving Averages (EMAs), which means the path of least resistance for the pair is to the upside. The upward momentum is supported by the Relative Strength Index (RSI), which stands in bullish territory above 50. However, the overbought condition indicates that further consolidation cannot be ruled out before positioning for any near-term USD/CNH appreciation.
The immediate resistance level for USD/CNH is seen near a low of November 17 at 7.2100. Further north, the next upside barrier is located at a high of November 20 at 7.2248, en route to a low of November 15 at 7.2384, and finally a low of November 16 at 7.2427.
On the flip side, the 100-hour EMA at 7.1776 acts as an initial support level for the pair. A break below the latter will see a drop to the 50-hour EMA at 7.1662. The additional downside filter to watch is the lower limit of the Bollinger Band at 7.1503, followed by a low of November 28 at 7.1424.
USD/CNH daily chart
Information on these pages contains forward-looking statements that involve risks and uncertainties. Markets and instruments profiled on this page are for informational purposes only and should not in any way come across as a recommendation to buy or sell in these assets. You should do your own thorough research before making any investment decisions. FXStreet does not in any way guarantee that this information is free from mistakes, errors, or material misstatements. It also does not guarantee that this information is of a timely nature. Investing in Open Markets involves a great deal of risk, including the loss of all or a portion of your investment, as well as emotional distress. All risks, losses and costs associated with investing, including total loss of principal, are your responsibility. The views and opinions expressed in this article are those of the authors and do not necessarily reflect the official policy or position of FXStreet nor its advertisers. The author will not be held responsible for information that is found at the end of links posted on this page.
If not otherwise explicitly mentioned in the body of the article, at the time of writing, the author has no position in any stock mentioned in this article and no business relationship with any company mentioned. The author has not received compensation for writing this article, other than from FXStreet.
FXStreet and the author do not provide personalized recommendations. The author makes no representations as to the accuracy, completeness, or suitability of this information. FXStreet and the author will not be liable for any errors, omissions or any losses, injuries or damages arising from this information and its display or use. Errors and omissions excepted.
The author and FXStreet are not registered investment advisors and nothing in this article is intended to be investment advice.
Recommended content
Editors’ Picks
EUR/USD clings to gains above 1.0750 after US data
EUR/USD manages to hold in positive territory above 1.0750 despite retreating from the fresh multi-week high it set above 1.0800 earlier in the day. The US Dollar struggles to find demand following the weaker-than-expected NFP data.
GBP/USD declines below 1.2550 following NFP-inspired upsurge
GBP/USD struggles to preserve its bullish momentum and trades below 1.2550 in the American session. Earlier in the day, the disappointing April jobs report from the US triggered a USD selloff and allowed the pair to reach multi-week highs above 1.2600.
Gold struggles to hold above $2,300 despite falling US yields
Gold stays on the back foot below $2,300 in the American session on Friday. The benchmark 10-year US Treasury bond yield stays in negative territory below 4.6% after weak US data but the improving risk mood doesn't allow XAU/USD to gain traction.
Bitcoin Weekly Forecast: Should you buy BTC here? Premium
Bitcoin (BTC) price shows signs of a potential reversal but lacks confirmation, which has divided the investor community into two – those who are buying the dips and those who are expecting a further correction.
Week ahead – BoE and RBA decisions headline a calm week
Bank of England meets on Thursday, unlikely to signal rate cuts. Reserve Bank of Australia could maintain a higher-for-longer stance. Elsewhere, Bank of Japan releases summary of opinions.