USD/CNH Price Forecast: Flat lines around 7.1620-7.1625; looks to US NFP for fresh impetus
- USD/CNH struggles to gain any meaningful traction as traders keenly await the US NFP report.
- The technical setup favors bearish traders and backs the case for a further depreciating move.
- Any attempted recovery could be seen as a selling opportunity ahead of the key 7.1800 level.

The USD/CNH pair extends its sideways consolidative price move for the third straight day on Thursday and remains close to the year-to-date low touched earlier this week. Spot prices currently trade around the 7.1620-7.1625 region, nearly unchanged for the day, as traders keenly await the release of the US Nonfarm Payrolls (NFP) report before placing fresh directional bets.
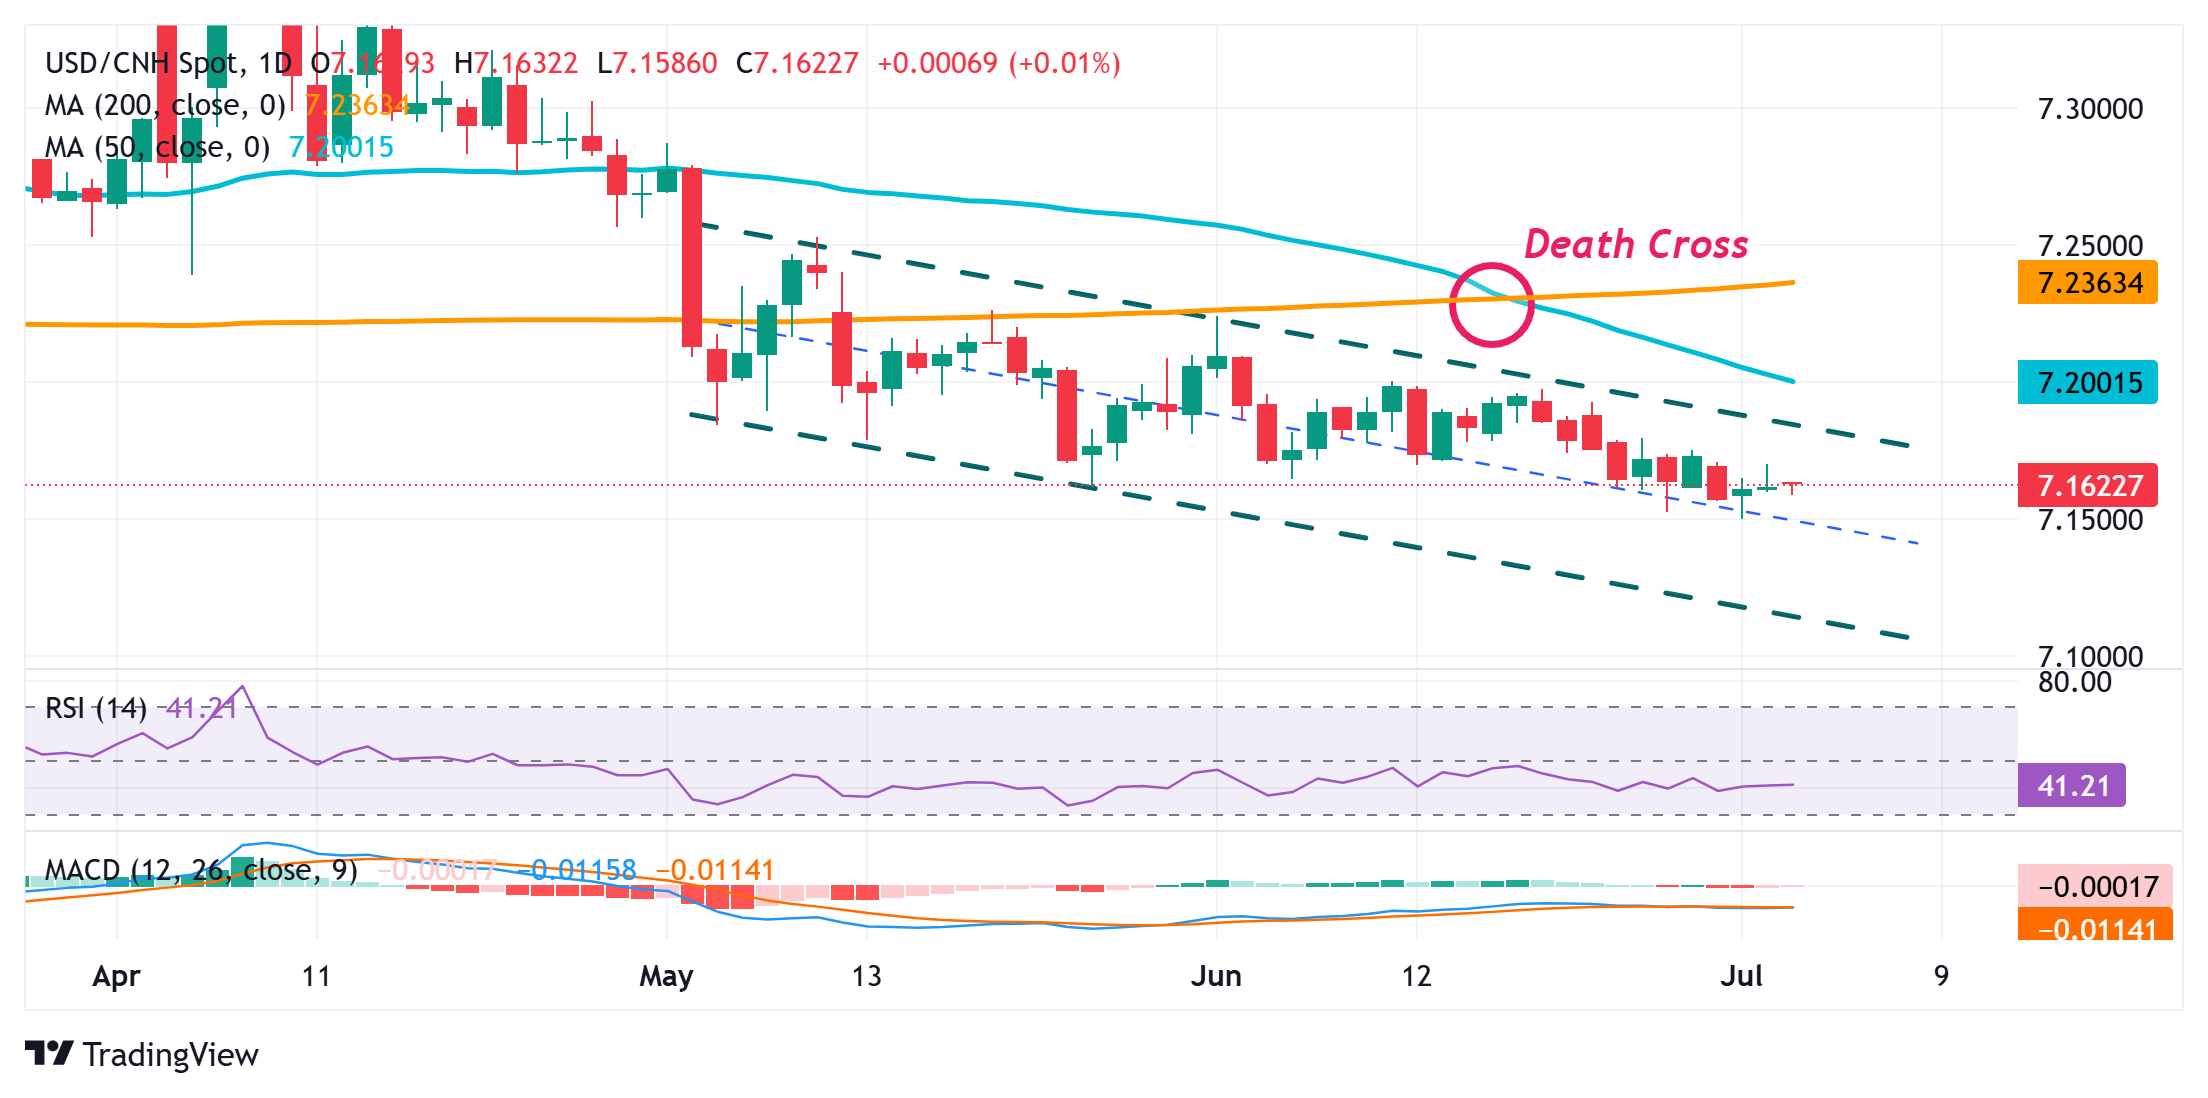
From a technical perspective, the recent decline witnessed over the past two months or so, along a descending channel, points to a well-established short-term downtrend. Furthermore, the occurrence of a death cross on the daily chart (50-day SMA crossing below 200-day SMA) and still negative oscillators suggests that the path of least resistance for the USD/CNH pair remains to the downside.
Hence, a slide below the 7.1570 horizontal support, back towards retesting the YTD low near the 7.1500 area, looks like a distinct possibility. Some follow-through selling should pave the way for a slide towards the 7.1450-7.1445 support en route to the 7.1415 area (November 7, 2024 low) en route to the 7.1400 round figure.
On the flip side, attempted recovery beyond the 7.1700 level, or the weekly high, might now confront stiff resistance near the 7.1715 support breakpoint. Any further move up could be seen as a selling opportunity and runs the risk of fading ahead of the 7.1800 mark. A sustained strength beyond the latter, however, could trigger a short-covering rally and pave the way for additional gains.
USD/CNH daily chart
Economic Indicator
Nonfarm Payrolls
The Nonfarm Payrolls release presents the number of new jobs created in the US during the previous month in all non-agricultural businesses; it is released by the US Bureau of Labor Statistics (BLS). The monthly changes in payrolls can be extremely volatile. The number is also subject to strong reviews, which can also trigger volatility in the Forex board. Generally speaking, a high reading is seen as bullish for the US Dollar (USD), while a low reading is seen as bearish, although previous months' reviews and the Unemployment Rate are as relevant as the headline figure. The market's reaction, therefore, depends on how the market assesses all the data contained in the BLS report as a whole.
Read more.Next release: Thu Jul 03, 2025 12:30
Frequency: Monthly
Consensus: 110K
Previous: 139K
Source: US Bureau of Labor Statistics
America’s monthly jobs report is considered the most important economic indicator for forex traders. Released on the first Friday following the reported month, the change in the number of positions is closely correlated with the overall performance of the economy and is monitored by policymakers. Full employment is one of the Federal Reserve’s mandates and it considers developments in the labor market when setting its policies, thus impacting currencies. Despite several leading indicators shaping estimates, Nonfarm Payrolls tend to surprise markets and trigger substantial volatility. Actual figures beating the consensus tend to be USD bullish.
Author

Haresh Menghani
FXStreet
Haresh Menghani is a detail-oriented professional with 10+ years of extensive experience in analysing the global financial markets.


