|

USD/CHF trying to eke out a small gain after a thin week, closing in on 0.9050

  • The USD/CHF is seeing a thin bounce for Friday, churning towards 0.9050.
  • The pair is holding steady after falling into the median range near major moving averages.
  • Up Next: On Tuesday, an appearance from SNB Chair Thomas Jordan, US CPI inflation.

The USD/CHF is on the high side for the week after Federal Reserve (Fed) Chairman Jerome Powell propped up the US Dollar (USD) with hawkish comments, sending broader market sentiment into a tailspin.

The USD has seen some weakness against the Swiss Franc (CHF) through October and November, and remains down 2.25% from October's peak near 0.9245. 

Coming up next week, early Tuesday sees Swiss National Bank (SNB) Chairman Thomas Jordan will be delivering the opening remarks at the Third High-Level Conference on Global Risk, Uncertainty, and Volatility, in Zurich.

Later that same day will be US Consumer Price Index (CPI) inflation, and investors will be drawing additional focus to the headline figures after the Fed's hawkish showing this week.

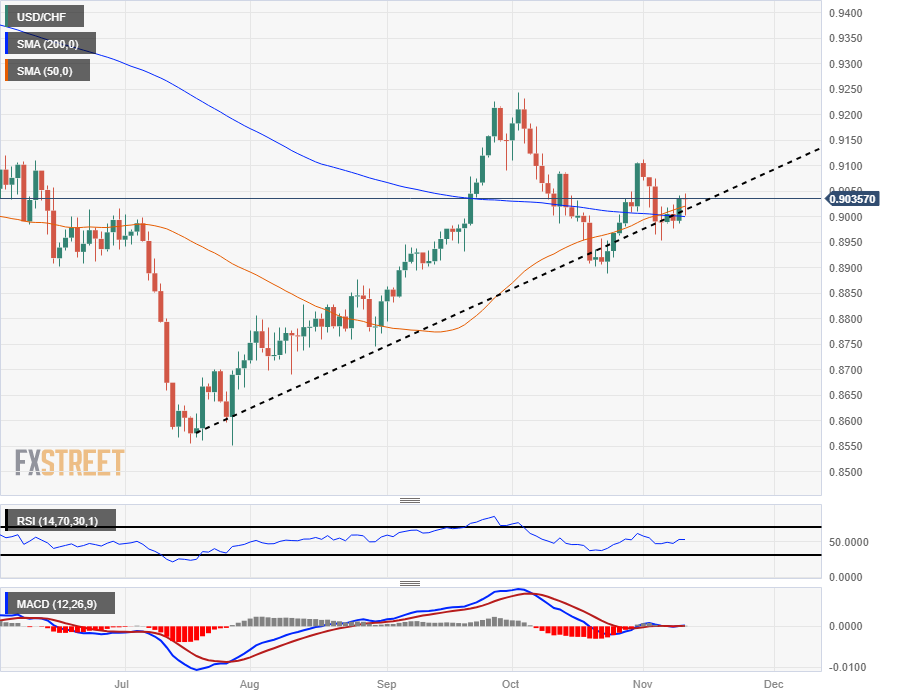
USD/CHF Technical Outlook

The USD/CHF has been cycling around the 200-day Simple Moving Average (SMA) since September, drawing out a constraining range from 0.9100 to 0.8900, but the pair's long-term bullish momentum from July's bottom near 0.8550 sees the 50-day SMA confirming a bullish cross of the longer moving average.

This week saw a decline into 0.8950 on Monday before the USD recovered into the week's midrange, seeing a bullish push on Thursday and holding steady at the top end for Friday.

USD/CHF Daily Chart

USD/CHF Technical Levels

USD/CHF

Overview
Today last price0.9032
Today Daily Change-0.0004
Today Daily Change %-0.04
Today daily open0.9036
 
Trends
Daily SMA200.8998
Daily SMA500.9017
Daily SMA1000.8901
Daily SMA2000.9001
 
Levels
Previous Daily High0.9041
Previous Daily Low0.8988
Previous Weekly High0.9113
Previous Weekly Low0.8966
Previous Monthly High0.9244
Previous Monthly Low0.8888
Daily Fibonacci 38.2%0.9021
Daily Fibonacci 61.8%0.9008
Daily Pivot Point S10.9002
Daily Pivot Point S20.8968
Daily Pivot Point S30.8949
Daily Pivot Point R10.9056
Daily Pivot Point R20.9075
Daily Pivot Point R30.9109

Author

Joshua Gibson

Joshua joins the FXStreet team as an Economics and Finance double major from Vancouver Island University with twelve years' experience as an independent trader focusing on technical analysis.

More from Joshua Gibson
Share:

Editor's Picks

AUD/USD falls to near 0.7100 after slipping below 50-day EMA

AUD/USD depreciates after registering minor gains in the previous day, trading around 0.7120 during the Asian hours. The technical analysis of the daily chart shows the pair consolidating sideways within a rectangle pattern, as neither bulls nor bears gain control. The AUD/USD pair is holding a slight bearish tone however as it sits beneath both the nine-day and 50-day EMAs.

160.00: USD/JPY back near intervention territory after upbeat US jobs report

US Nonfarm Payrolls beat expectations by a wide margin in May, with 172K jobs added. The US Dollar rebounds after the release, helping USD/JPY recover from its intraday lows. Warnings from Japanese authorities continue to limit upside potential near the 160.00 threshold.

Gold targets $4,300 amid stronger Dollar

Gold faces increasing selling interest and navigates the area of three-month lows near the $4,300 mark per troy ounce on Friday. The precious metal’s decline comes as traders assess the stronger-than-expected NFP, while the bid bias in the Greenback and higher US Treasury yields also collaborate with the retracement.

Cardano hits five-year low even as Hoskinson clarifies "break" isn't an exit

Cardano (ADA) price is down 10% at press time on Friday, extending losses over 30% so far this week amid Charles Hoskinson's clarification that "break" isn't an exit.

Week ahead – Fed countdown begins amid US inflation data and geopolitical risks

Fed Chair Warsh’s first meeting approaches as key US inflation data could reshape expectations. Oil prices remain elevated as US-Iran talks continue; tariffs also return to the spotlight. ECB is expected to hike; will it be a one-off move or is July live?

The US economy defies the rules: 100 days into the Oil shock and the recession signal is still missing

More than three months after the start of the Iran war and the resulting disruption to global energy markets, the US economy continues to display remarkable resilience. The conflict has triggered a sharp rise in Oil prices, reignited inflationary pressures and fueled widespread concerns about a potential economic slowdown.