|

USD/CHF technical analysis: Greenback nearing the October lows, consolidating near 0.9870 level

  • USD/CHF is consolidating its losses this Thursday.
  • The level to beat for bears is the 0.9855 support.
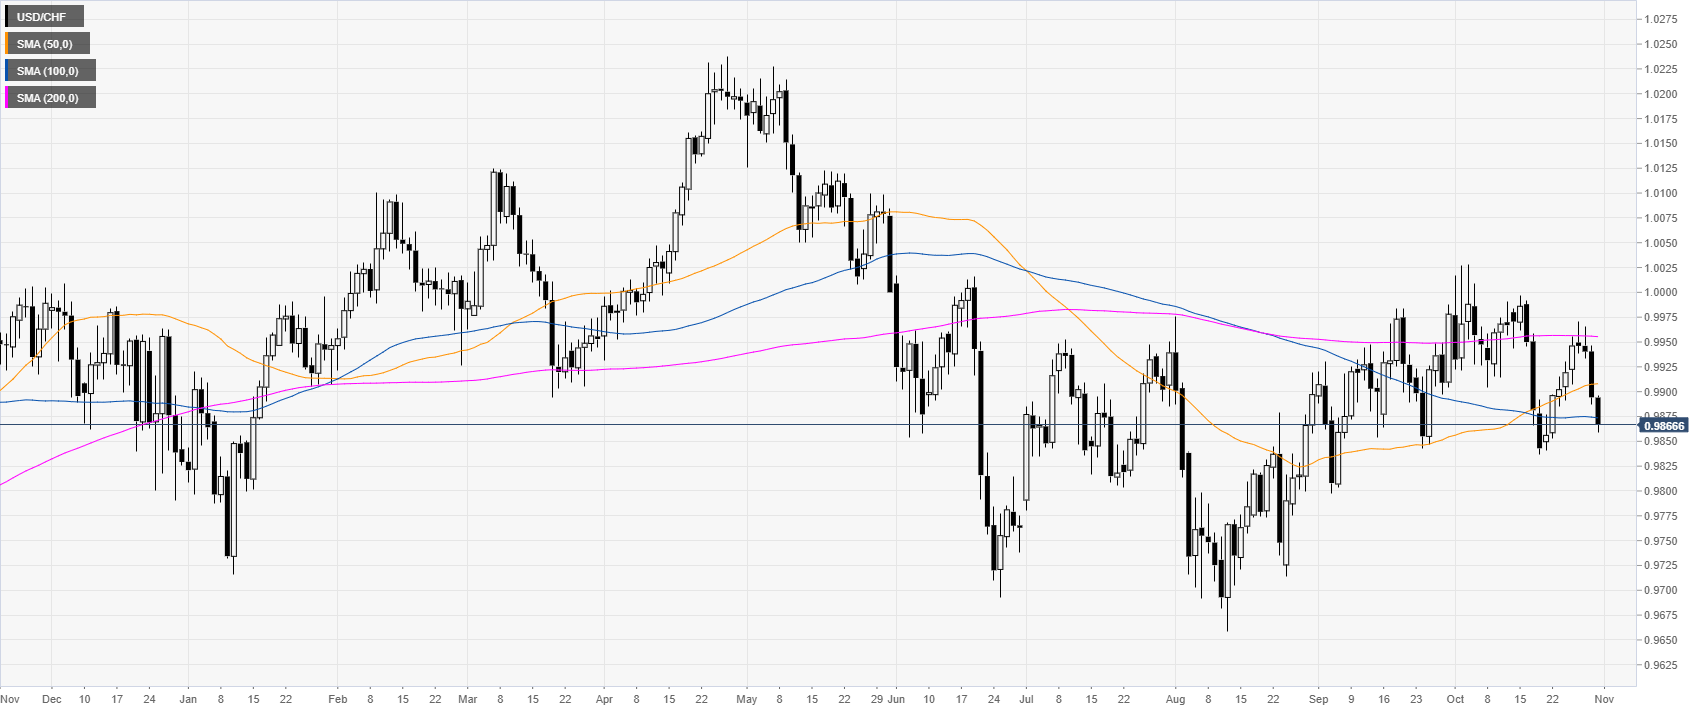
 

USD/CHF daily chart


On the daily chart, USD/CHF is trading in a range below its main daily simple moving averages (DSMAs). The market is approaching the October low, currently at the 0.9837 price level. 
 

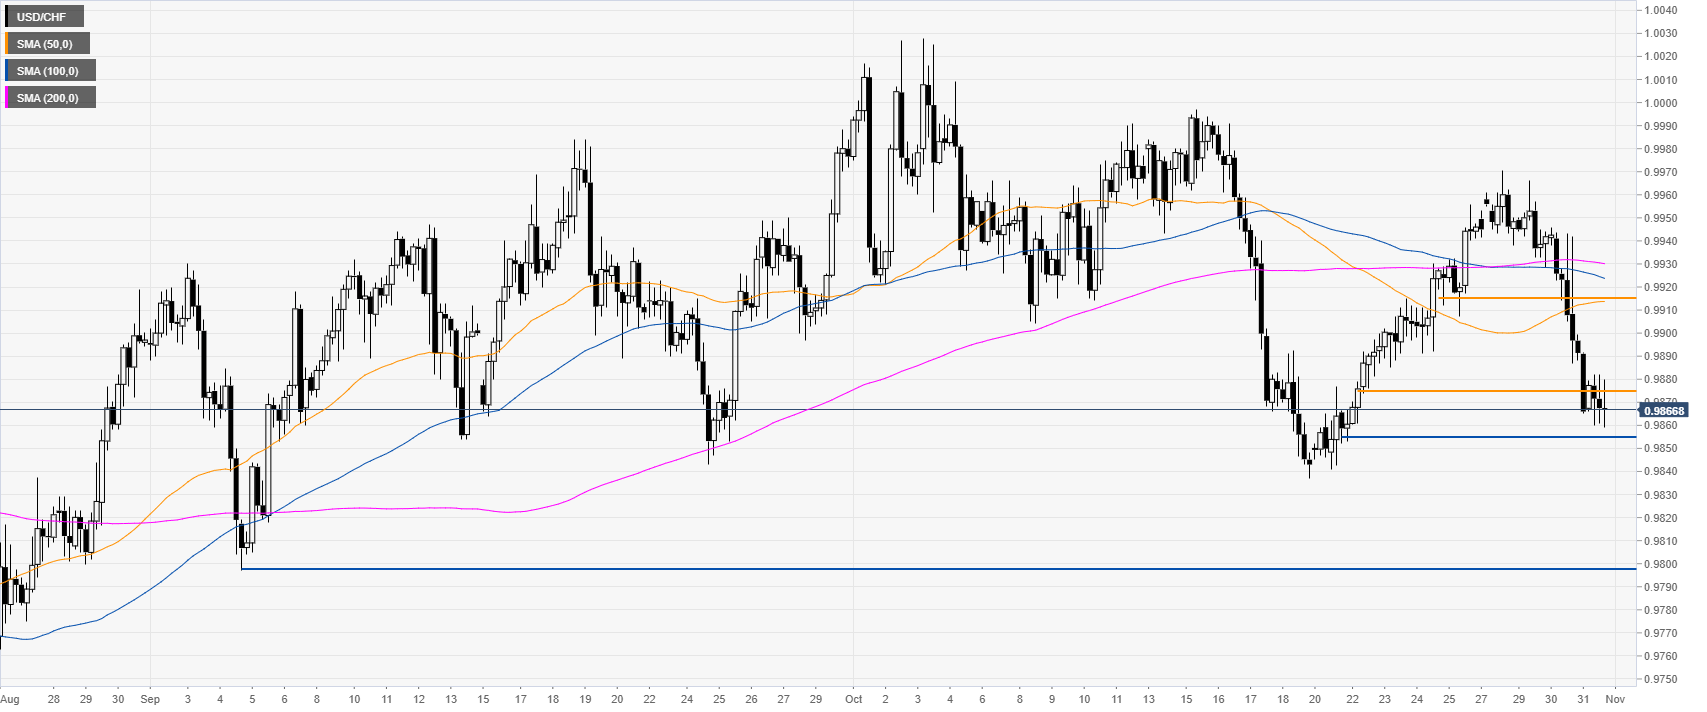
USD/CHF four-hour chart


USD/CHF is under bearish pressure below its main SMAs as the market is nearing the 0.9855 support level. A break below this level can lead to an extension of the current bear leg towards the 0.9798 price level, according to the Technical Confluences Indicator. 
 

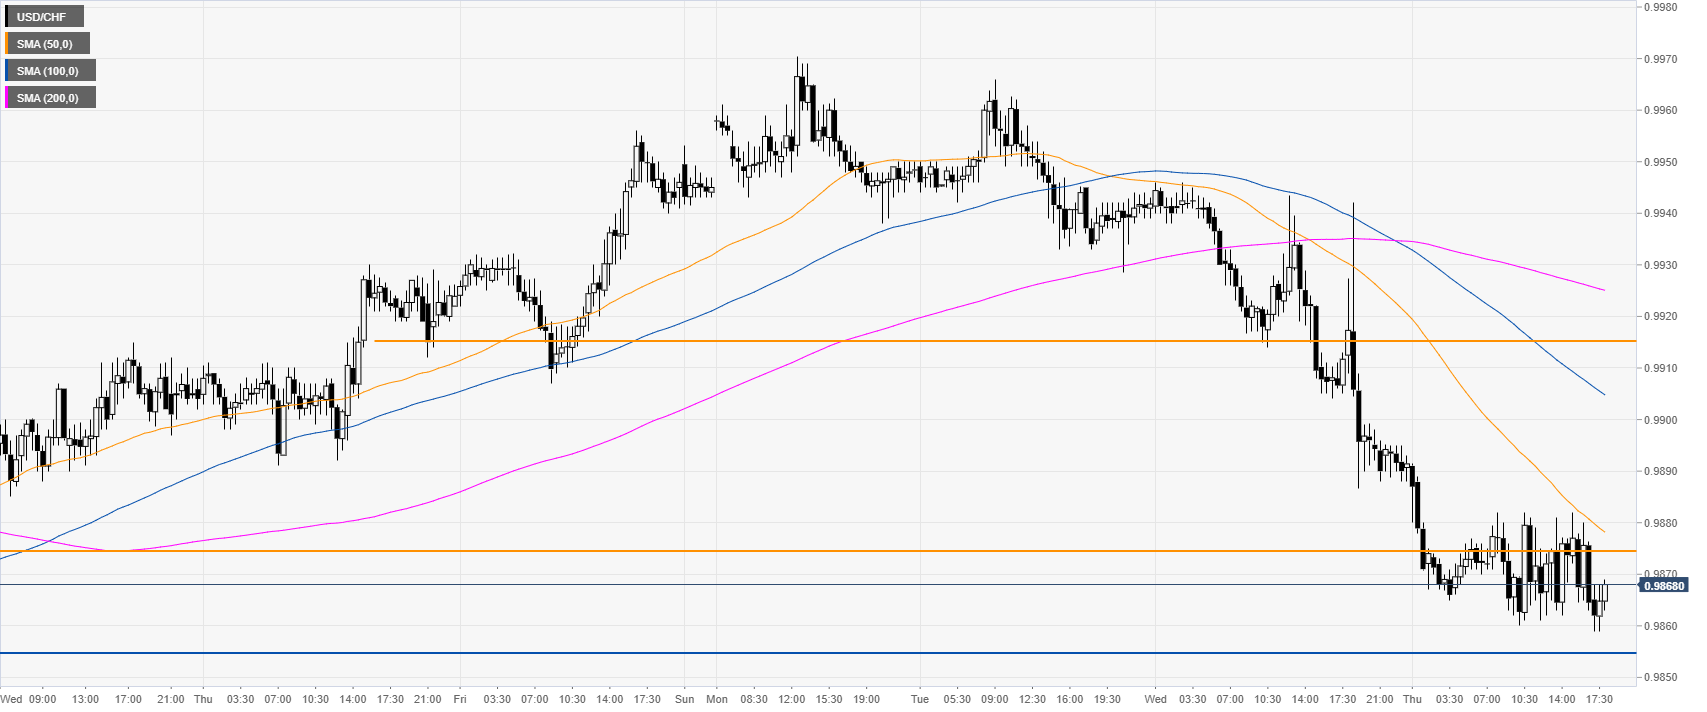
USD/CHF 30-minute chart


USD/CHF is trading below its main SMAs, suggesting a bearish bias in the near term. However, the market has been consolidation the recent losses this Thursday which is just a pause. Resistances can be seen at the 0.9875 and 0.9915 price levels, according to the Technical Confluences Indicator. 
 

Additional key levels

USD/CHF

Overview
Today last price0.9867
Today Daily Change-0.0027
Today Daily Change %-0.27
Today daily open0.9894
 
Trends
Daily SMA200.9932
Daily SMA500.9907
Daily SMA1000.9874
Daily SMA2000.9956
 
Levels
Previous Daily High0.9946
Previous Daily Low0.9887
Previous Weekly High0.9956
Previous Weekly Low0.9841
Previous Monthly High0.9988
Previous Monthly Low0.9797
Daily Fibonacci 38.2%0.9909
Daily Fibonacci 61.8%0.9923
Daily Pivot Point S10.9872
Daily Pivot Point S20.985
Daily Pivot Point S30.9813
Daily Pivot Point R10.9931
Daily Pivot Point R20.9968
Daily Pivot Point R30.9991

Author

Flavio Tosti

Flavio Tosti

Independent Analyst


More from Flavio Tosti
Share:

Editor's Picks

AUD/USD eyes 0.7150 barrier nine-day EMA

AUD/USD inches higher after registering modest losses in the previous day, trading around 0.7130 during the Asian hours. The technical analysis of the daily chart indicates that the pair is moving sideways within the rectangle pattern, suggesting a consolidation as neither the bulls nor the bears have enough momentum to take control of the market.

USD/JPY trades below 160.00 intervention threshold; bullish bias intact

The USD/JPY pair attracts some sellers during the Asian session amid fears that authorities will step in again to prop up the Japanese Yen. Furthermore, the Israel-Lebanon truce prompts some profit-taking around the US Dollar and exerts downward pressure on the currency pair.

Gold defends 200-day SMA, rises toward $4,500

Gold is attempting a tepid recovery toward $4,500 on Thursday, as renewed optimism in the Mideast geopolitical front calms market nerves. This cautious optimism across Asian markets weighs on Oil prices, and diminishes the US Dollar’s safe-haven appeal, helping Gold stage a decent comeback from the weekly low of $4,424.


Hyperliquid: ETF demand, capital rotation fuel HYPE rally as Bitcoin melts

Hyperliquid price sustains an upward trend near its all-time high of $75.76 on Thursday after posting 80% gains in May, while Bitcoin (BTC) retraces below $65,000, triggering a market-wide panic.

Kevin Warsh takes the Fed helm: What it means for the US Dollar
The Federal Reserve moves away from the highly predictable "forward guidance" model of the Jerome Powell era to a new “Kevin Warsh environment”, characterized by less communication, more policy surprises, and an increased focus on the Fed's complex balance sheet.
Recession on paper: What really moves the Canadian Loonie now?

Statistics Canada handed the headline writers a gift and the analysts a headache. Real GDP shrank 0.1% on an annualized basis in the first quarter, and with the fourth quarter of 2025 revised down to a 1.0% contraction, that is two negative quarters in a row, the textbook definition of a technical recession and Canada's first since the pandemic.