|

USD/CHF technical analysis: Greenback hanging near the November highs against CHF

  • USD/CHF is trading flat on the day, consolidating the gains of the last two days. 
  • The level to beat for bulls is the 0.9940/0.9956 resistance zone.
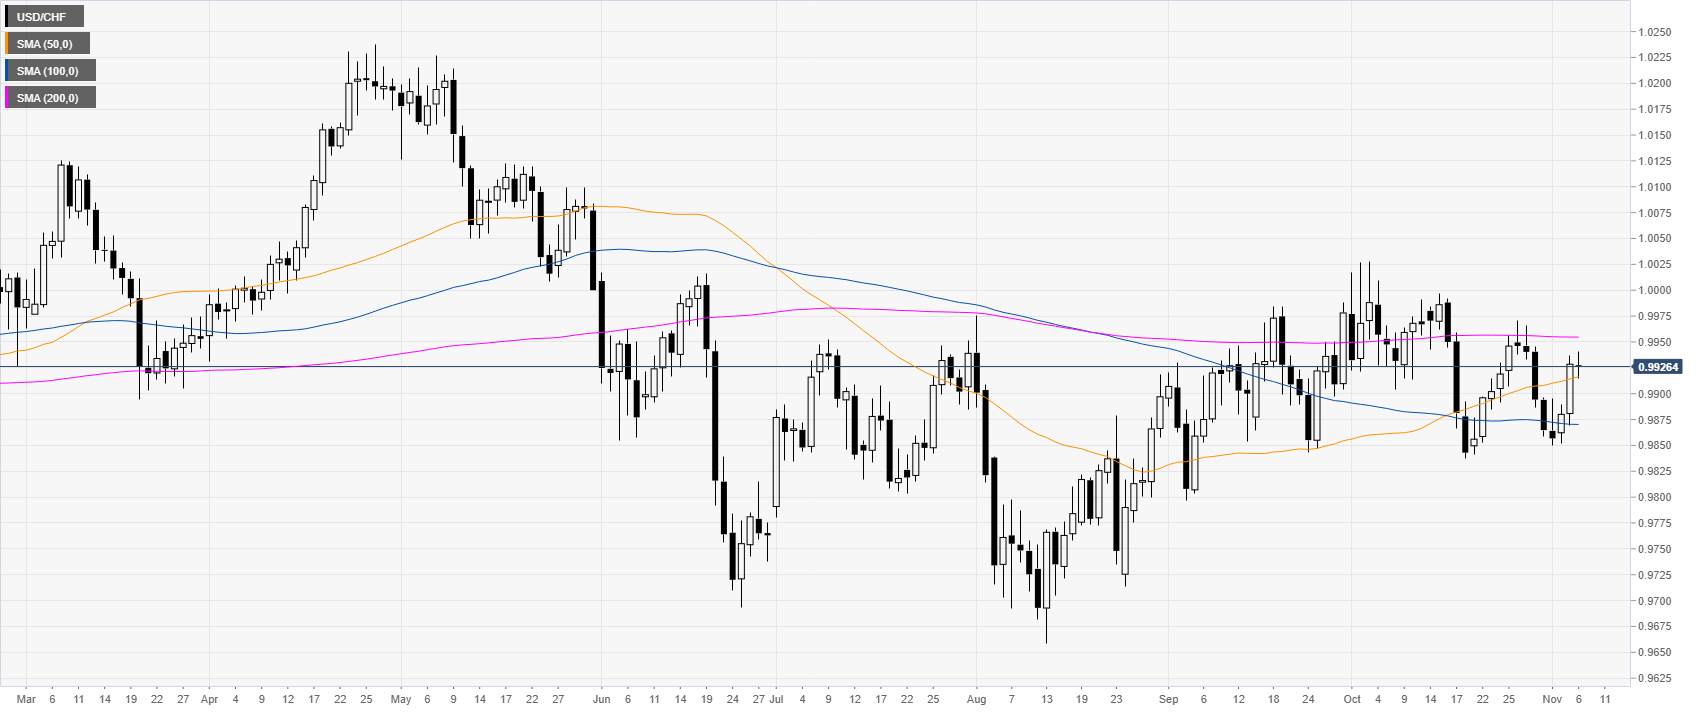
 

USD/CHF daily chart

 
On the daily chart, USD/CHF is trading in a range below its 200-day simple moving average (DMA). The market is holding just above the 50 SMA today at the 0.9916 level. 


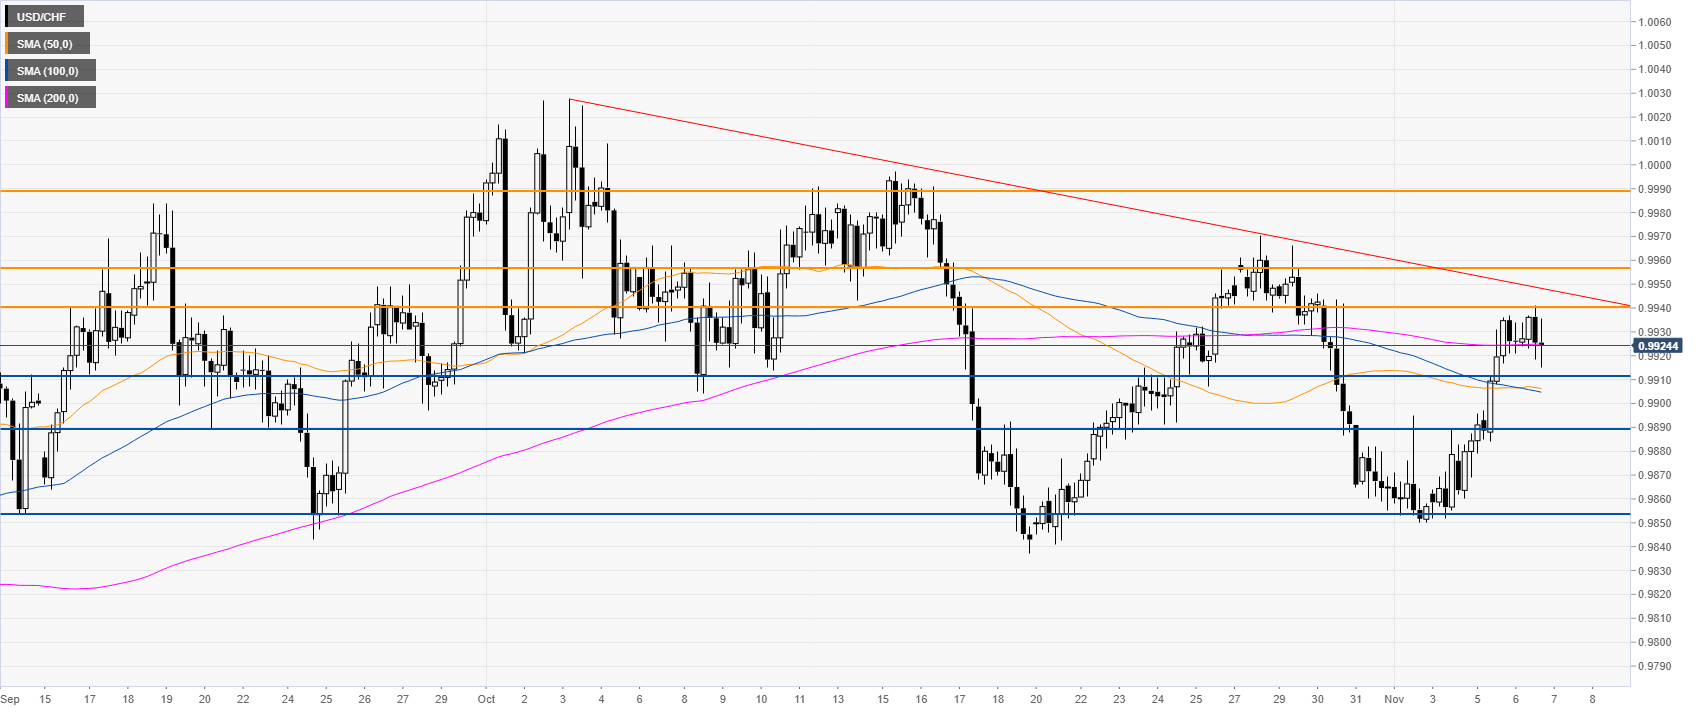
USD/CHF four-hour chart

 
USD/CHF is trading near the monthly highs while above its main SMAs, suggesting a bullish bias in the medium term. Buyers will need to overcome the 0.9940/0.9956 resistance zone and the descending trendline. Further up, 0.9988 resistance awaits, according to the Technical Confluences Indicator. 


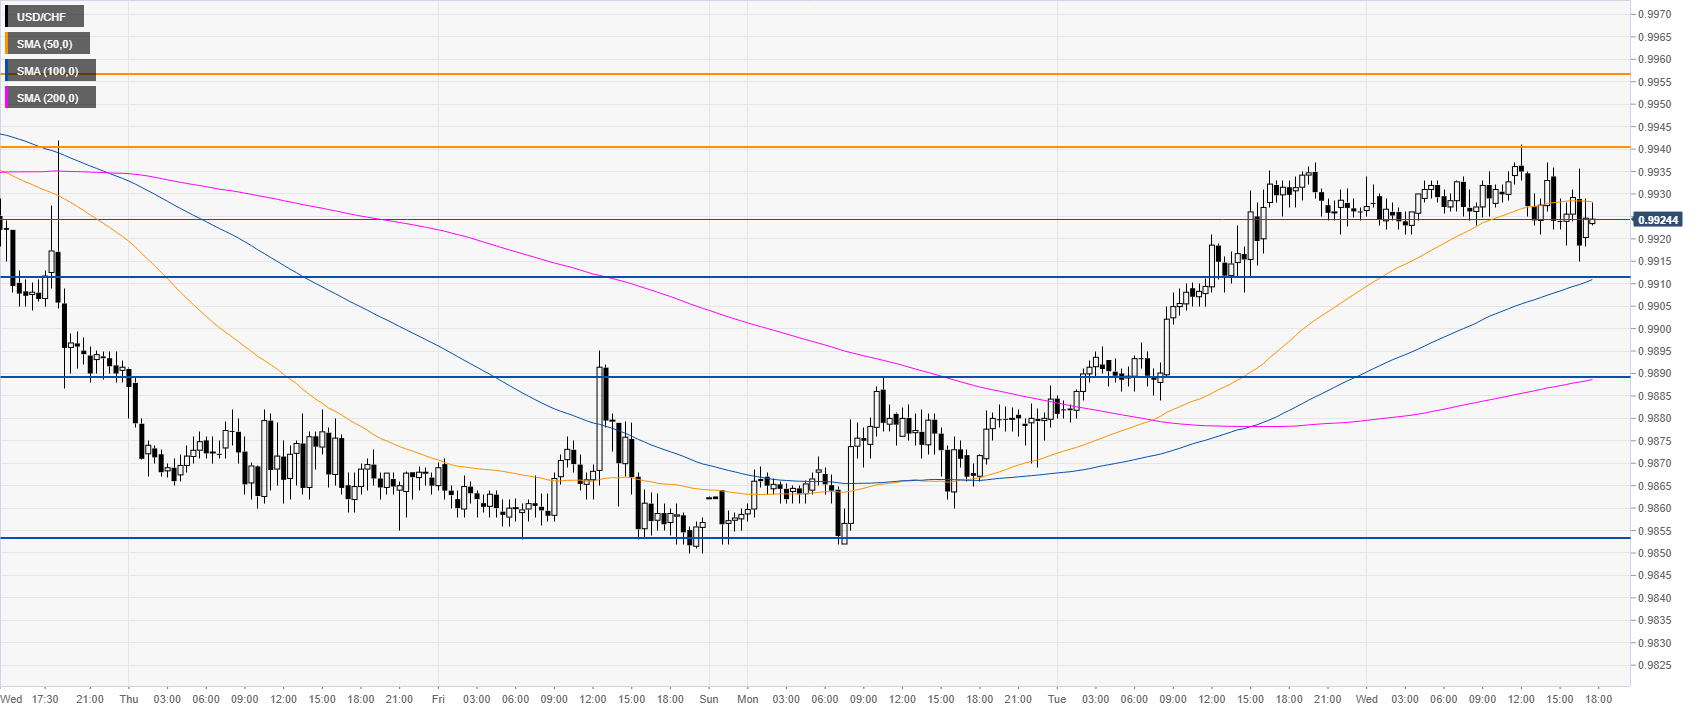
USD/CHF 30-minute chart


USD/CHF is trading above upward sloping 100/200 SMAs, suggesting a bullish bias in the medium term. Pullbacks down could find support near 0.9910, 0.9889 and 0.9853, according to the Technical Confluences Indicator. 
 

Additional key levels

USD/CHF

Overview
Today last price0.9925
Today Daily Change-0.0003
Today Daily Change %-0.03
Today daily open0.9928
 
Trends
Daily SMA200.9918
Daily SMA500.9914
Daily SMA1000.987
Daily SMA2000.9955
 
Levels
Previous Daily High0.9937
Previous Daily Low0.9869
Previous Weekly High0.997
Previous Weekly Low0.985
Previous Monthly High1.0028
Previous Monthly Low0.9837
Daily Fibonacci 38.2%0.9911
Daily Fibonacci 61.8%0.9895
Daily Pivot Point S10.9886
Daily Pivot Point S20.9843
Daily Pivot Point S30.9818
Daily Pivot Point R10.9954
Daily Pivot Point R20.9979
Daily Pivot Point R31.0022

Author

Flavio Tosti

Flavio Tosti

Independent Analyst


More from Flavio Tosti
Share:

Editor's Picks

EUR/USD stays well offered below 1.1800

The selling pressure on EUR/USD is picking up pace, with the pair slipping decisively below the key 1.1800 level and sliding to fresh two week lows as Wednesday’s session draws to a close. The move lower comes as the US Dollar finds renewed strength after the latest round of US data and the release of the FOMC Minutes. Next of note on the docket will be the US weekly Initial Jobless Claims.
 

GBP/USD reaches multi-day lows near 1.3500

GBP/USD reverses its initial upside momentum and is now adding to previous declines, approaching the 1.3500 region on Wednesday. Cable’s downtick comes on the back of decent gains in the Greenback and easing UK inflation figures, which seem to have reinforced the case for a BoE rate cut in March.

Gold battle to regain $5,000 continues

Gold is back on the front foot on Wednesday, shaking off part of the early week softness and challenging two-day highs near the $5,000 mark per troy ounce. The move comes ahead of the FOMC Minutes and is unfolding despite an intense rebound in the US Dollar.

Australia unemployment rate set to edge up within overall strong labor market

The Australian monthly employment report is scheduled for release on Thursday at 00:30 GMT, and market participants anticipate a modest increase in jobs in January. The Australian Bureau of Statistics is expected to announce that the country added 20K new jobs in the month, while the Unemployment Rate is forecast at 4.2%, up from the 4.1% posted in December.

Mixed UK inflation data no gamechanger for the Bank of England

Food inflation plunged in January, but service sector price pressure is proving stickier. We continue to expect Bank of England rate cuts in March and June. The latest UK inflation read is a mixed bag for the Bank of England, but we doubt it drastically changes the odds of a March rate cut.

Sui extends sideways action ahead of Grayscale’s GSUI ETF launch

Sui is extending its downtrend for the second consecutive day, trading at 0.95 at the time of writing on Wednesday. The Layer-1 token is down over 16% in February and approximately 34% from the start of the year, aligning with the overall bearish sentiment across the crypto market.