USD/CHF technical analysis: Buyers concentrate on 200-day SMA while waiting for SNB
- 200-day SMA continues to limit the pair’s upside since early January.
- 61.8% Fibonacci retracement becomes nearby support.
- All eyes on the SNB decision and press conference by the Governor.
USD/CHF’s recent recovery still falls beneath 200-day SMA as it takes the rounds near 0.9950 during the early Asian session on Thursday. The pair traders now await monetary policy decision and assessment from the Swiss National Bank (SNB) for fresh clues.
Should it manage to cross 200-day simple moving average (SMA) level of 0.9970, 21-day SMA around 1.0006 and five-week-old descending trend-line at 1.0023 can question buyers.
In a case where the quote rallies beyond 1.0023, late-May highs around 1.0100 and 1.0125 can regain market attention.
On the flipside, 61.8% Fibonacci retracement of January to April upside at 0.9915 and current month low near 0.9855 act as immediate supports for the pair.
Given the sellers’ dominance past-0.9855, 0.9790 and the present year bottom around 0.9715 can lure the bears.
USD/CHF daily chart
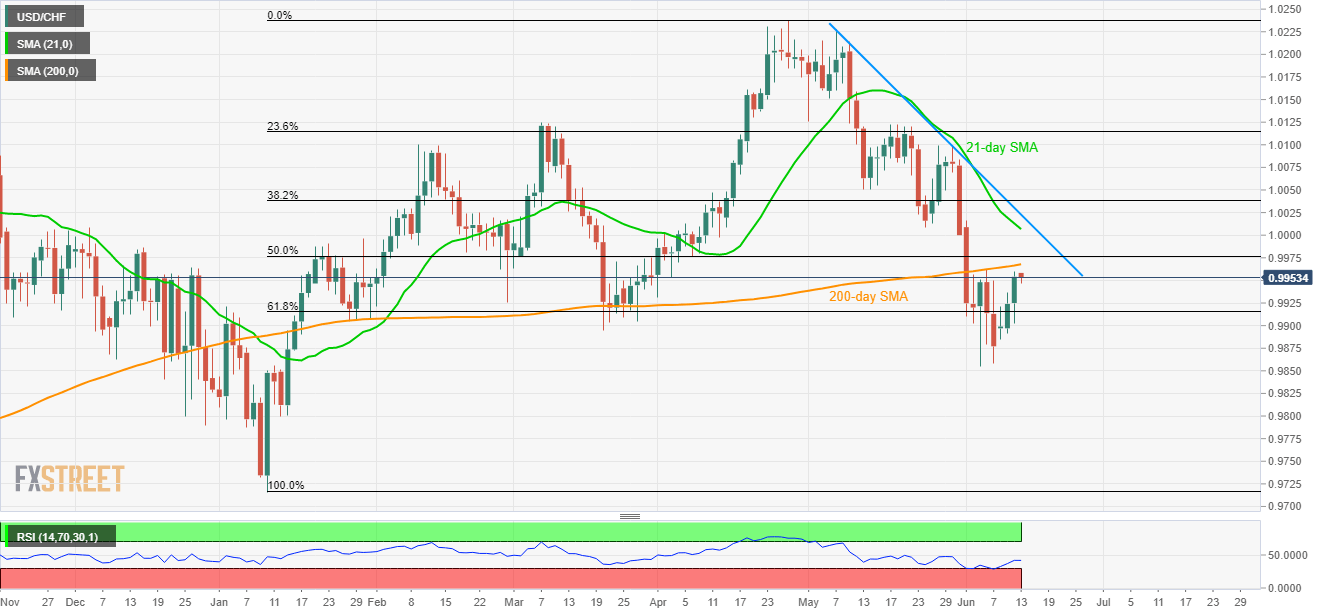
Trend: Bearish
Author

Anil Panchal
FXStreet
Anil Panchal has nearly 15 years of experience in tracking financial markets. With a keen interest in macroeconomics, Anil aptly tracks global news/updates and stays well-informed about the global financial moves and their implications.


