|

USD/CHF technical analysis: 50-day SMA limits immediate upside amid bearish MACD

  • USD/CHF struggles around 38.2% Fibonacci retracement after declining to a three-week low.
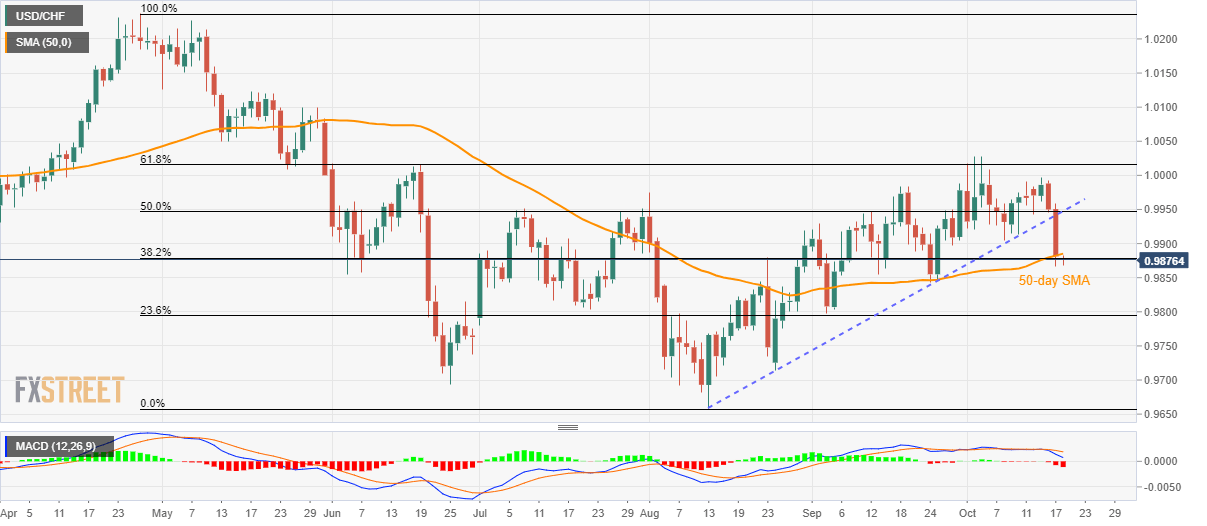
  • Bearish MACD favors further downpour to 0.9800/9795 support-zone.

With its sustained trading below 50-day SMA, coupled with the bearish MACD, USD/CHF stays on the sellers’ radar even if it clings to 0.9880 during early Friday.

The September 24 low nearing 0.9840 acts as immediate support for the pair while the previous month low and 23.6% Fibonacci retracement of April-August south-run, close to 0.9800/9795 support-zone, could restrict further downside.

During the pair’s further weakness below 0.9795, 0.9715 and 0.9690 will become bears’ favorites.

Should traders ignore a bearish signal from the 12-bar Moving Average Convergence and Divergence (MACD), they need to provide a daily closing beyond 50-day Simple Moving Average (SMA) surrounding 0.9885 to aim for last week's low near 0.9905.

However, odds of short-term weakness can’t be defied unless the pair rises back beyond 0.9947/50 confluence including a two-month-old rising trend line and 50% Fibonacci retracement.

USD/CHF daily chart

Trend: bearish

additional important levels

Overview
Today last price0.9877
Today Daily Change-4 pips
Today Daily Change %-0.04%
Today daily open0.9881
 
Trends
Daily SMA200.9941
Daily SMA500.9882
Daily SMA1000.9877
Daily SMA2000.9956
 
Levels
Previous Daily High0.9959
Previous Daily Low0.9866
Previous Weekly High0.9991
Previous Weekly Low0.9904
Previous Monthly High0.9988
Previous Monthly Low0.9797
Daily Fibonacci 38.2%0.9902
Daily Fibonacci 61.8%0.9923
Daily Pivot Point S10.9845
Daily Pivot Point S20.9809
Daily Pivot Point S30.9752
Daily Pivot Point R10.9938
Daily Pivot Point R20.9995
Daily Pivot Point R31.0031

Author

Anil Panchal

Anil Panchal

FXStreet

Anil Panchal has nearly 15 years of experience in tracking financial markets. With a keen interest in macroeconomics, Anil aptly tracks global news/updates and stays well-informed about the global financial moves and their implications.

More from Anil Panchal
Share:

Editor's Picks

EUR/USD trims gains, hovers around 1.1900 post-US data

EUR/USD trades slightly on the back foot around the 1.1900 region in a context dominated by the resurgence of some buying interest around the US Dollar on turnaround Tuesday. Looking at the US docket, Retail Sales disappointed expectations in December, while the ADP 4-Week Average came in at 6.5K.

GBP/USD comes under pressure near 1.3680

The better tone in the Greenback hurts the risk-linked complex on Tuesday, prompting GBP/USD to set aside two consecutive days of gains and trade slightly on the defensive below the 1.3700 mark. Investors, in the meantime, keep their attention on key UK data due later in the week.

Gold loses some traction, still above $5,000

Gold faces some selling pressure on Tuesday, surrendering part of its recent two-day advance although managing to keep the trade above the $5,000 mark per troy ounce. The daily pullback in the precious metal comes in response to the modest rebound in the US Dollar, while declining US Treasury yields across the curve seem to limit the downside.

XRP holds $1.40 amid ETF inflows and stable derivatives market

Ripple trades under pressure, with immediate support at $1.40 holding at the time of writing on Tuesday. A recovery attempt from last week’s sell-off to $1.12 stalled at $1.54 on Friday, leading to limited price action between the current support and the resistance.

Dollar drops and stocks rally: The week of reckoning for US economic data

Following a sizeable move lower in US technology Stocks last week, we have witnessed a meaningful recovery unfold. The USD Index is in a concerning position; the monthly price continues to hold the south channel support.

XRP holds $1.40 amid ETF inflows and stable derivatives market

Ripple trades under pressure, with immediate support at $1.40 holding at the time of writing on Tuesday. A recovery attempt from last week’s sell-off to $1.12 stalled at $1.54 on Friday, leading to limited price action between the current support and the resistance.