|

USD/CHF Price Prediction: Potential Bull Flag pattern forming

  • USD/CHF might be developing a Bull Flag continuation pattern. 
  • This suggests there will be an extension of the uptrend to upside targets higher. 

USD/CHF – which looked as if it might be reversing trend and starting a new short-term downtrend at the start of the week – suddenly turned on a dime and spiked higher on Wednesday. 

The pair rallied to a higher high, giving the established uptrend a shot in the arm. USD/CHF has since peaked and started to go sideways, forming what looks like a potential Bull Flag continuation price pattern.

USD/CHF 4-hour Chart 
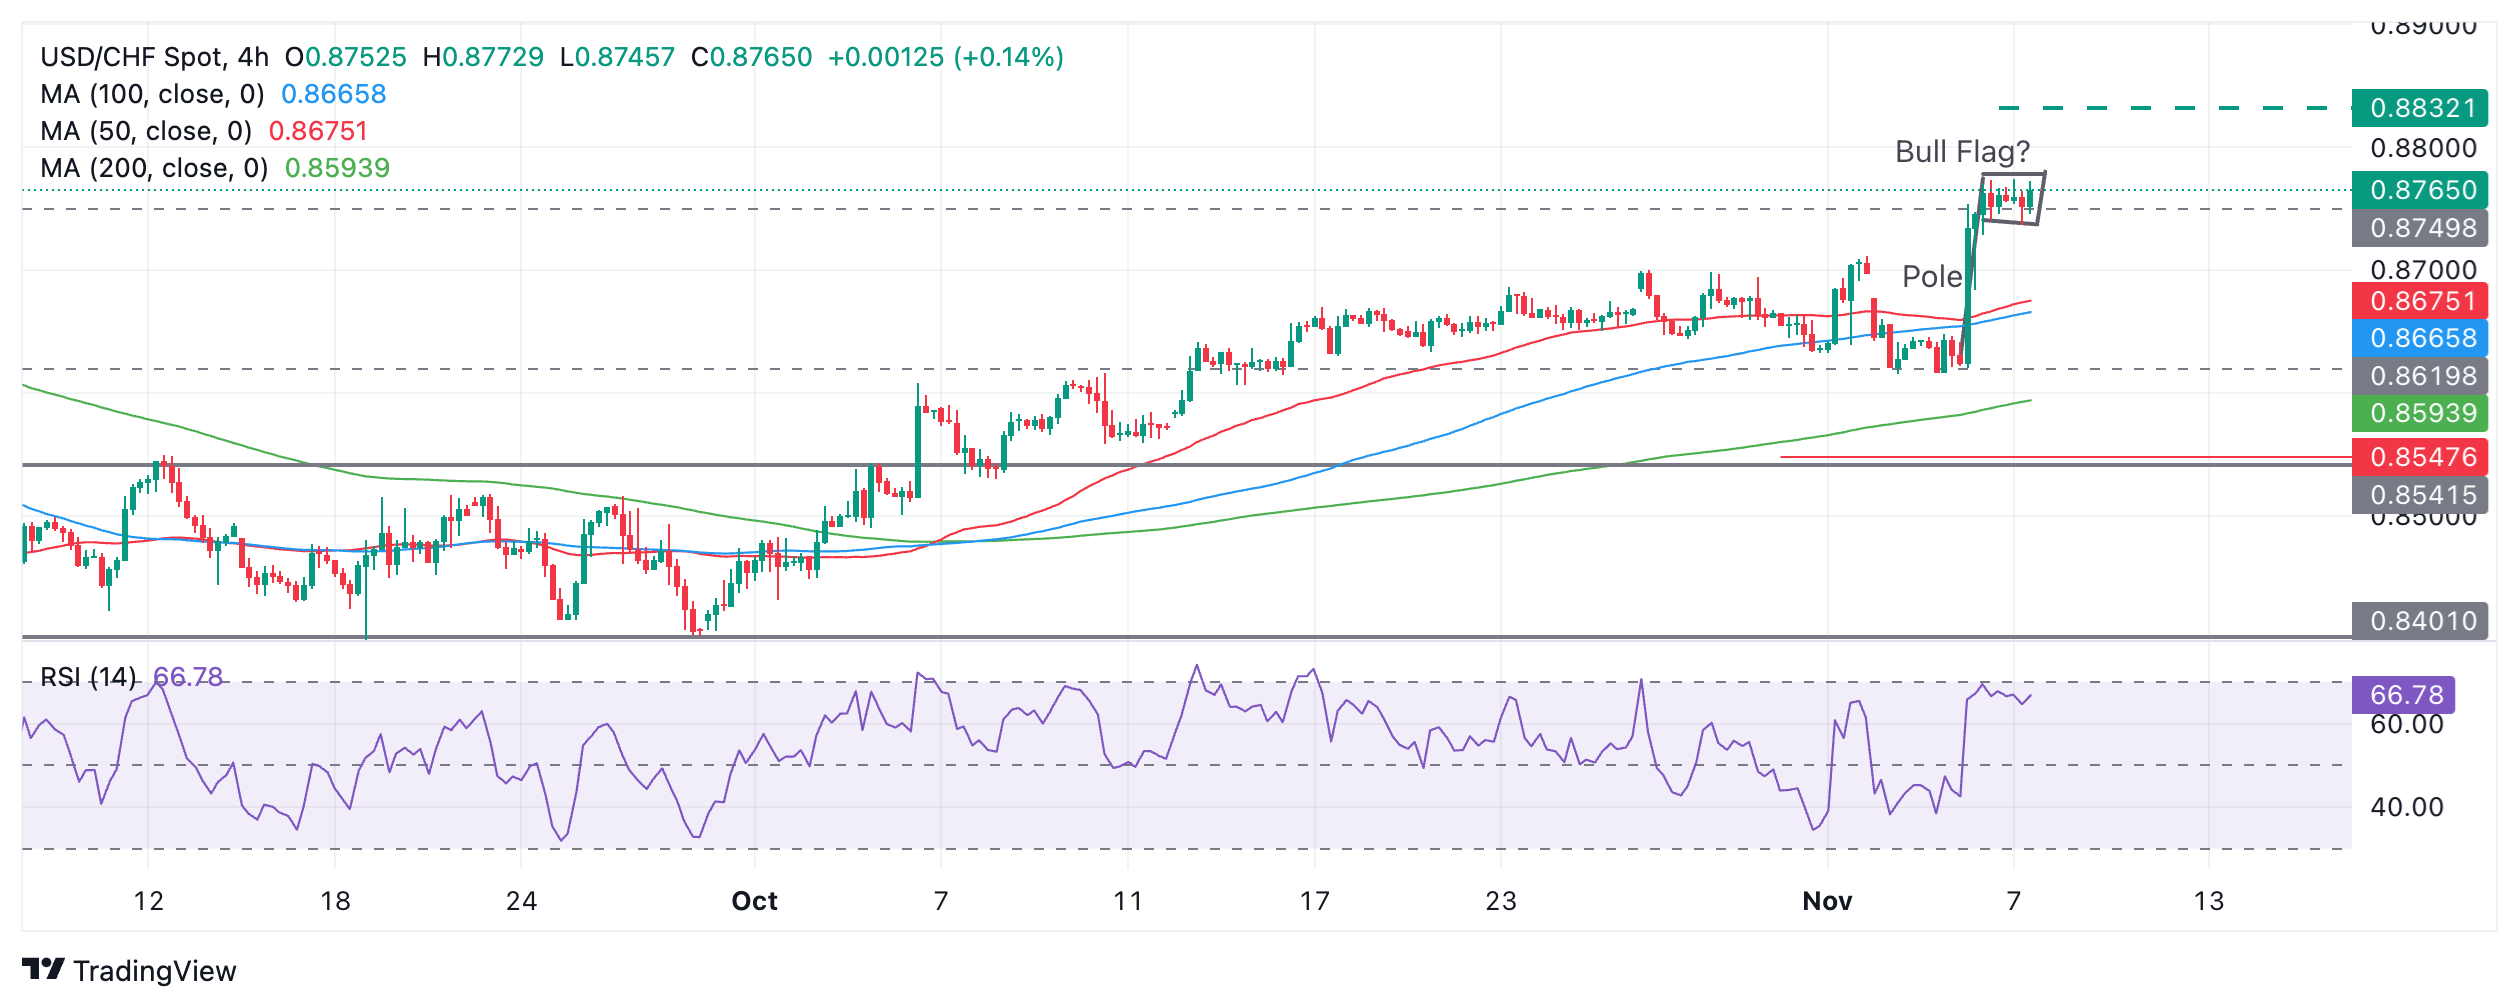
If it is indeed a Bull Flag pattern it indicates more upside is on the cards for USD/CHF. 

A break above the flag’s high of 0.8775 would probably result in a continuation higher to a target at 0.8832, the 61.8% Fibonacci extrapolation of the  flagpole or “Pole” higher. The flagpole is the steep rally prior to the consolidation. 

The Relative Strength Index (RSI) momentum indicator is not yet overbought but it is close. This suggests there is still more scope for upside before the uptrend becomes temporarily exhausted. If RSI enters the overbought zone it will be a signal for long-holders not to add to their positions. 

Author

Joaquin Monfort

Joaquin Monfort is a financial writer and analyst with over 10 years experience writing about financial markets and alt data. He holds a degree in Anthropology from London University and a Diploma in Technical analysis.


More from Joaquin Monfort
Share:

Editor's Picks

AUD/USD seems vulnerable near 0.6800, 10-month low amid bullish USD

AUD/USD languishes near a 10-month low during the Asian session on Friday, awaiting a break below 0.6800 before the next leg up amid a bullish US Dollar. Firming Fed rate-hike expectations, along with fading hopes for US-Iran diplomacy, help the USD hold gains at its highest level since April 2025. Moreover, the RBA’s dovish tilt undermines the Aussie and backs the case for further losses.

USD/JPY bulls turn cautious near 160.00 amid intervention risks

USD/JPY enters a bullish consolidation phase around its highest level since early September as bulls turn cautious amid intervention risk near 160.00. Meanwhile, the downside seems cushioned as the wide US-Japan interest rate gap keeps the Yen carry trade active. Furthermore, the possibility of a jumbo Fed rate hike and Middle East uncertainties hold the US Dollar near a 19-month top, supporting the currency pair.


Gold remains on the back foot below $3,900

Gold now alternates gains with losses below the $3,900 mark per troy ounce on Friday. The precious metal struggles to regain traction amid the firmer US Dollar, mixed US Treasury yields and expectations of further tightening by the Fed at its December meeting.

Bitcoin just posted five straight losing weeks, and the storm may not be over yet

Bitcoin is struggling to find support, slipping below $70,000 as multiple headwinds threaten to push the Crypto King lower. The much-anticipated “Uptober” rally failed to materialize, with persistent selling pressure and widespread liquidations instead reinforcing the “Rektober” narrative.

Week ahead – Fed Minutes, inflation data and Nvidia earnings to guide investors

Fed minutes may add to hawkish tone as bets of 50-bps hike grow. Nvidia to report earnings as bar to impress high after spy scandal. Trade and geopolitics to be focal point of Trump-Xi summit.

Gold hit its lowest level of 2026 near $3,850
Gold (XAU/USD) attempts to stabilize around $3,890 on Friday after falling to $3,852 on Thursday, its lowest level since October 2025. The precious metal has lost more than 4% this week, as investors increasingly anticipate further monetary tightening from the Federal Reserve (Fed). The latest decline reflects a sharp change in market expectations.















