USD/CHF Price Analysis: Yearly trendline, 61.8% Fibonacci on the bears’ radar
- USD/CHF trades near the multi-month low marked Wednesday.
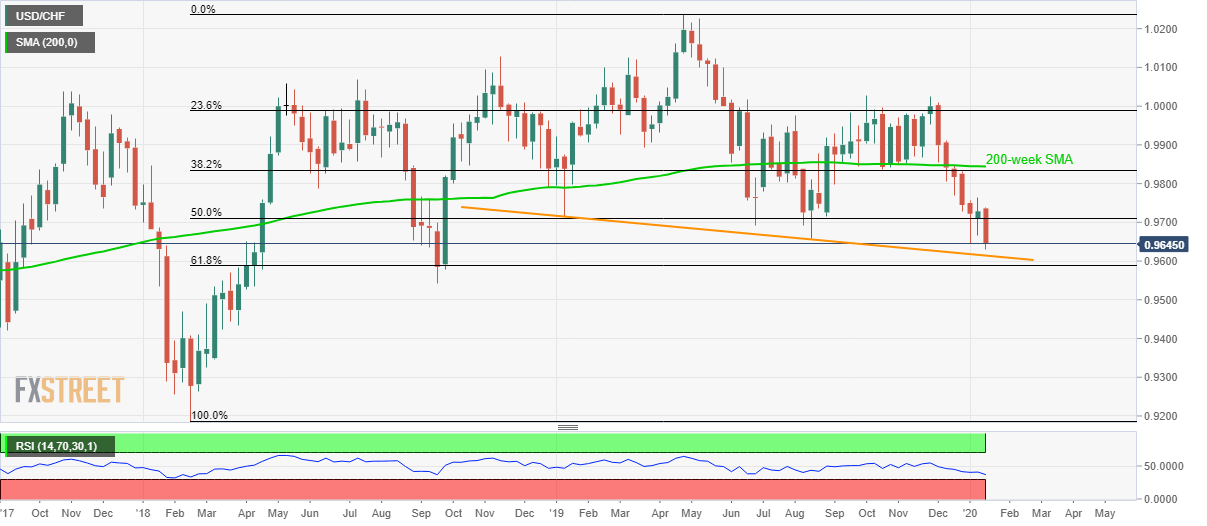
- 38.2% Fibonacci retracement, 200-week SMA keep the pair’s upside limited.
- September 2018 low may return to the chart during heavy declines.

USD/CHF takes rounds to 0.9645 while heading into the European session on Thursday. The pair witnesses pullback from the lowest since September 2018, tested the previous day.
Bears are in control while targeting a downward sloping trend line plotted from January 2019, at 0.9615, as well as 61.8% Fibonacci retracement of 2018-19 upside move, near 0.9585.
Given the sellers’ failure to respect the key Fibonacci support, September 2018 bottom surrounding 0.9540 grabs the spotlight.
Alternatively, 0.9765 can act as an immediate upside barrier ahead of the 200-week SMA and 38.2% Fibonacci retracement around 0.9835/45 region.
USD/CHF weekly chart
Trend: Bearish
Author

Anil Panchal
FXStreet
Anil Panchal has nearly 15 years of experience in tracking financial markets. With a keen interest in macroeconomics, Anil aptly tracks global news/updates and stays well-informed about the global financial moves and their implications.


