USD/CHF Price Analysis: Surges to the highest level since September 2020, around 0.9235


  • USD/CHF gained strong positive traction on Thursday and jumped to near six-month tops.
  • RSI on the daily chart is flashing overbought conditions and warrants some caution for bulls.
  • Any meaningful pullback below the 0.9200 mark might now be seen as a buying opportunity.

The USD/CHF pair caught some aggressive bids during the European session and spiked to the highest level since late September 2020, around the 0.9230-35 region in the last hour.

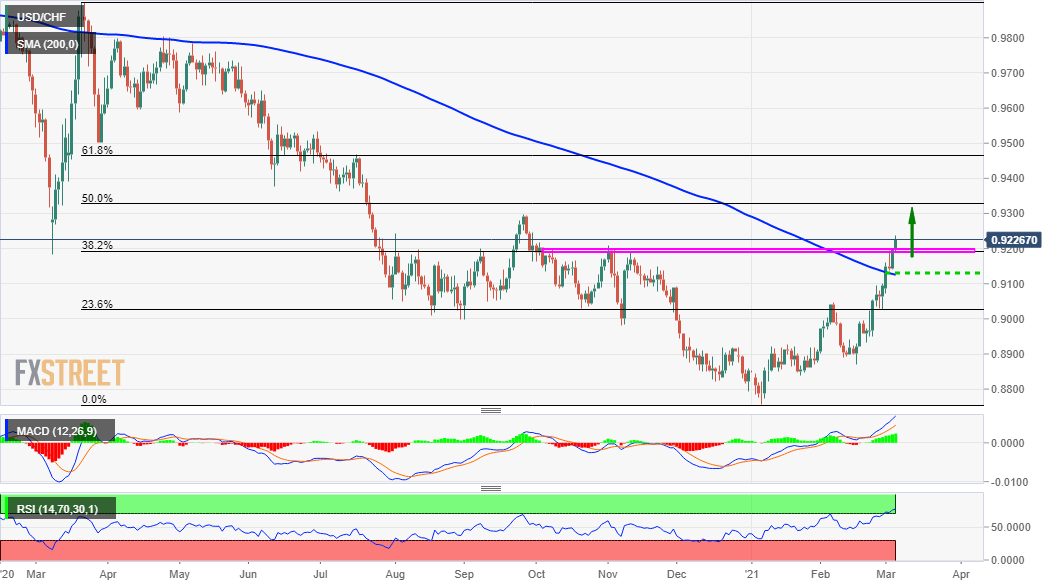
Given this week's breakthrough the very important 200-day SMA, a sustained move beyond the 0.9200 mark was seen as a fresh trigger for bullish traders. The mentioned handle coincided with the 38.2% Fibonacci level of the 0.9902-0.8758 downfall and should now act as a key pivotal point for short-term traders.

Meanwhile, RSI on the daily chart is already flashing overbought conditions and warrants some caution for bullish traders. This, in turn, makes it prudent to wait for some near-term consolidation or a modest pullback towards the 0.9200 mark before positioning for an extension of the ongoing strong appreciating move.

The USD/CHF pair now seems all set to appreciate further and aim to test September 2020 swing highs, just ahead of the 0.9300 round-figure mark. Some follow-through buying should pave the way for a move towards challenging the 50% Fibo. level hurdle, around the 0.9340 region.

On the flip side, any meaningful pullback now seems to find decent support near the 0.9200 mark (38.2% Fibo. level). Further weakness below might still be seen as a buying opportunity. This, in turn, should help limit the downside near the 0.9140-30 region (200-DMA), which now seems to act as a strong base for the USD/CHF pair.

USD/CHF daily chart

fxsoriginal

Technical levels to watch

USD/CHF

Overview
Today last price 0.923
Today Daily Change 0.0031
Today Daily Change % 0.34
Today daily open 0.9199
 
Trends
Daily SMA20 0.9007
Daily SMA50 0.893
Daily SMA100 0.8982
Daily SMA200 0.9128
 
Levels
Previous Daily High 0.9199
Previous Daily Low 0.9141
Previous Weekly High 0.9102
Previous Weekly Low 0.8948
Previous Monthly High 0.9102
Previous Monthly Low 0.8871
Daily Fibonacci 38.2% 0.9177
Daily Fibonacci 61.8% 0.9163
Daily Pivot Point S1 0.916
Daily Pivot Point S2 0.9121
Daily Pivot Point S3 0.9102
Daily Pivot Point R1 0.9218
Daily Pivot Point R2 0.9238
Daily Pivot Point R3 0.9277


Share: Feed news

Information on these pages contains forward-looking statements that involve risks and uncertainties. Markets and instruments profiled on this page are for informational purposes only and should not in any way come across as a recommendation to buy or sell in these assets. You should do your own thorough research before making any investment decisions. FXStreet does not in any way guarantee that this information is free from mistakes, errors, or material misstatements. It also does not guarantee that this information is of a timely nature. Investing in Open Markets involves a great deal of risk, including the loss of all or a portion of your investment, as well as emotional distress. All risks, losses and costs associated with investing, including total loss of principal, are your responsibility. The views and opinions expressed in this article are those of the authors and do not necessarily reflect the official policy or position of FXStreet nor its advertisers. The author will not be held responsible for information that is found at the end of links posted on this page.

If not otherwise explicitly mentioned in the body of the article, at the time of writing, the author has no position in any stock mentioned in this article and no business relationship with any company mentioned. The author has not received compensation for writing this article, other than from FXStreet.

FXStreet and the author do not provide personalized recommendations. The author makes no representations as to the accuracy, completeness, or suitability of this information. FXStreet and the author will not be liable for any errors, omissions or any losses, injuries or damages arising from this information and its display or use. Errors and omissions excepted.

The author and FXStreet are not registered investment advisors and nothing in this article is intended to be investment advice.

Recommended content


Recommended content

Editors’ Picks

EUR/USD holds steady near 1.0650 amid risk reset

EUR/USD holds steady near 1.0650 amid risk reset

EUR/USD is holding onto its recovery mode near 1.0650 in European trading on Friday. A recovery in risk sentiment is helping the pair, as the safe-haven US Dollar pares gains. Earlier today, reports of an Israeli strike inside Iran spooked markets. 

EUR/USD News

GBP/USD recovers toward 1.2450 after UK Retail Sales data

GBP/USD recovers toward 1.2450 after UK Retail Sales data

GBP/USD is rebounding toward 1.2450 in early Europe on Friday, having tested 1.2400 after the UK Retail Sales volumes stagnated again in March, The pair recovers in tandem with risk sentiment, as traders take account of the likely Israel's missile strikes on Iran. 

GBP/USD News

Gold: Middle East war fears spark fresh XAU/USD rally, will it sustain?

Gold: Middle East war fears spark fresh XAU/USD rally, will it sustain?

Gold price is trading close to $2,400 early Friday, reversing from a fresh five-day high reached at $2,418 earlier in the Asian session. Despite the pullback, Gold price remains on track to book the fifth weekly gain in a row.

Gold News

Bitcoin Price Outlook: All eyes on BTC as CNN calls halving the ‘World Cup for Bitcoin’

Bitcoin Price Outlook: All eyes on BTC as CNN calls halving the ‘World Cup for Bitcoin’

Bitcoin price remains the focus of traders and investors ahead of the halving, which is an important event expected to kick off the next bull market. Amid conflicting forecasts from analysts, an international media site has lauded the halving and what it means for the industry.   

Read more

Geopolitics once again take centre stage, as UK Retail Sales wither

Geopolitics once again take centre stage, as UK Retail Sales wither

Nearly a week to the day when Iran sent drones and missiles into Israel, Israel has retaliated and sent a missile into Iran. The initial reports caused a large uptick in the oil price.

Read more

Forex MAJORS

Cryptocurrencies

Signatures