|

USD/CHF Price Analysis: Stumbles as the CHF gains strength and forms bearish-harami

  • Swiss Producer and Import Prices for April remain stable at 0.2% MoM, with a 90% chance of a 25 bps rate hike by SNB in June.
  • New York Fed’s manufacturing index nosedives, while Fed speakers emphasize high inflation and the need for higher interest rates.
  • USD/CHF tests solid support faces downward bias as bearish RSI and 3-day RoC indicators suggest sellers remain in control.

The USD/CHF marched down after hitting a daily high of 0.8987, but US Dollar (USD) bulls’ lack of strength, weak US economic data, and expectations of an aggressive Swiss National Bank (SNB) bolstered the Swiss Franc (CHF). At the time of writing, the USD/CHF is trading at 0.8944, down 0.40%.

Fundamental backdrop

At the beginning of the week, the USD/CHF continued to trend lower, but it’s facing solid support at around the 20-day Exponential Moving Average (EMA). Data in the European session showed that the Producer and Import Prices for April in Switzerland were unchanged at 0.2% MoM, while annually based, ticked lower from 2.1% to 1%. Money market futures odds for a 25 bps rate hike by the SNB are at 90% by the June meeting.

On the US front, the New York Fed announced that its manufacturing index plummeted to -31.3 from the -3.9% contraction expected. Further data showed that the labor market is easing, but prices are rising. Regarding Fed speakers crossing the wires, they reiterated that inflation is high, that there’s some work to do, and that higher interest rates are still working its way through the economy.

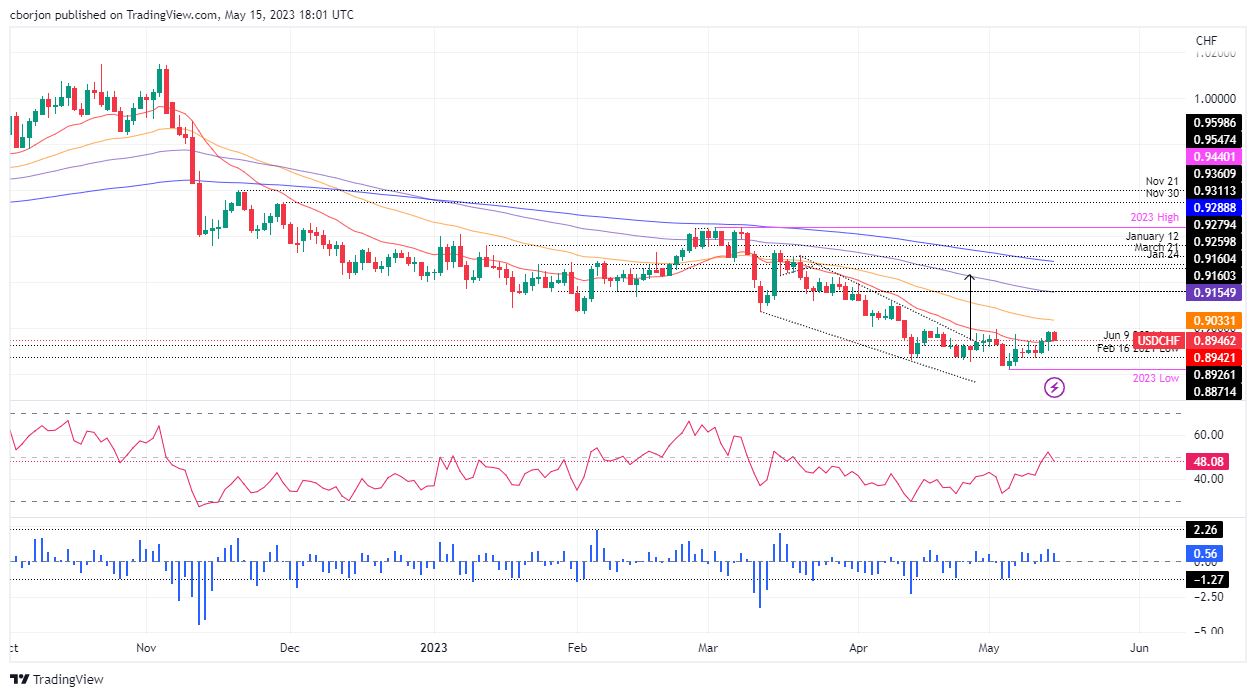
USD/CHF Price Analysis: Technical outlook

The USD/CHF is downward biased but testing solid support, which, if it holds, can pave the way for further upside. Nevertheless, the Relative Strength Index (RSI) indicator at 48.19 is in bearish territory, suggesting that sellers remain in charge, while the 3-day Rate of Change (RoC) remains above zero but is about to turn bearish.

If USD/CHF resumes below the 20-day EMA At 0.8942, the next support would be 0.8900. The break below will expose the May 10 daily low of 0.8868 before challenging the YTD low of 0.8879. Conversely, the USD/CHF first resistance would be the 0.9000 figure. A breach of the latter will expose the 50-day EMA At 0.9033, followed by the 100-day EMA at 0.9155.

USD/CHF

Overview
Today last price0.8946
Today Daily Change-0.0037
Today Daily Change %-0.41
Today daily open0.8983
 
Trends
Daily SMA200.8924
Daily SMA500.9069
Daily SMA1000.9165
Daily SMA2000.9415
 
Levels
Previous Daily High0.8988
Previous Daily Low0.8897
Previous Weekly High0.8988
Previous Weekly Low0.8868
Previous Monthly High0.9198
Previous Monthly Low0.8852
Daily Fibonacci 38.2%0.8953
Daily Fibonacci 61.8%0.8932
Daily Pivot Point S10.8924
Daily Pivot Point S20.8866
Daily Pivot Point S30.8834
Daily Pivot Point R10.9014
Daily Pivot Point R20.9046
Daily Pivot Point R30.9105

Author

Christian Borjon Valencia

Christian Borjon began his career as a retail trader in 2010, mainly focused on technical analysis and strategies around it. He started as a swing trader, as he used to work in another industry unrelated to the financial markets.

More from Christian Borjon Valencia
Share:

Markets move fast. We move first.

Orange Juice Newsletter brings you expert driven insights - not headlines. Every day on your inbox.

By subscribing you agree to our Terms and conditions.

Editor's Picks

EUR/USD could test 1.1750 amid strengthening bullish bias

EUR/USD remains flat after two days of small losses, trading around 1.1740 during the Asian hours on Thursday. On the daily chart, technical analysis indicates a strengthening of a bullish bias, as the pair continues to trade within an ascending channel pattern.

GBP/USD consolidates above mid-1.3300s as traders await BoE and US CPI report

The GBP/USD pair struggles to capitalize on the overnight bounce from the 1.3310 area, or a one-week low, and oscillates in a narrow band during the Asian session on Thursday. Spot prices currently trade around the 1.3370 region, down less than 0.10% for the day, as traders opt to wait on the sidelines ahead of the key central bank event risk and US consumer inflation data.

Gold awaits weekly trading range breakout ahead of US CPI report

Gold struggles to capitalize on the previous day's move higher back closer to the $4,350 level and trades with a mild negative bias during the Asian session on Thursday. The downtick could be attributed to some profit-taking amid a US Dollar uptick, though it is likely to remain cushioned on the back of a supportive fundamental backdrop. 

Dogecoin breaks key support amid declining investor confidence

Dogecoin trades in the red on Thursday, following a 4% decline on the previous day. The DOGE supply in profit declines as large wallet investors trim their portfolios. Derivatives data shows a surge in bearish positions amid declining retail interest.

Monetary policy: Three central banks, three decisions, the same caution

While the Fed eased its monetary policy on 10 December for the third consecutive FOMC meeting, without making any guarantees about future action, the BoE, the ECB and the BoJ are holding their respective meetings this week. 

Dogecoin Price Forecast: DOGE breaks key support amid declining investor confidence

Dogecoin (DOGE) trades in the red on Thursday, following a 4% decline on the previous day. The DOGE supply in profit declines as large wallet investors trim their portfolios. Derivatives data shows a surge in bearish positions amid declining retail interest.