|

USD/CHF Price Analysis: Recoups from Thursday’s losses, edges toward 0.9870

  • USD/CHF prepares to finish the week with decent gains of 0.65%.
  • The weekly chart depicts the pair as neutral-to-upward biased, further extending the uptrend but unable to crack 0.9900.
  • The USD/CHF daily chart portrays the major as upward biased, and once it clears the 0.9886 mares, the 0.9900 figure would be next.

The USD/CHF finished the week with substantial gains on Friday, up by 1.20%  in the day, due to Federal Reserve officials crossing newswires, reiterating that the Fed would not pivot in the near term and will keep rates elevated to temper inflation. At the time of writing, the USD/CHF is trading at 0.9870.

USD/CHF Price Analysis: Technical outlook

The USD/CHF weekly chart shows the majors closing just below the July 11 week high of 0.9886, keeping the neutral-to-upward bias unchanged. Traders should be aware that, albeit closing below the aforementioned July 11 high, the USD/CHF extended the successive series of higher highs/lows, opening the door for further gains. If the USD/CHF clears 0.9886, the 0.9900 figure is the next supply zone, followed by the parity.

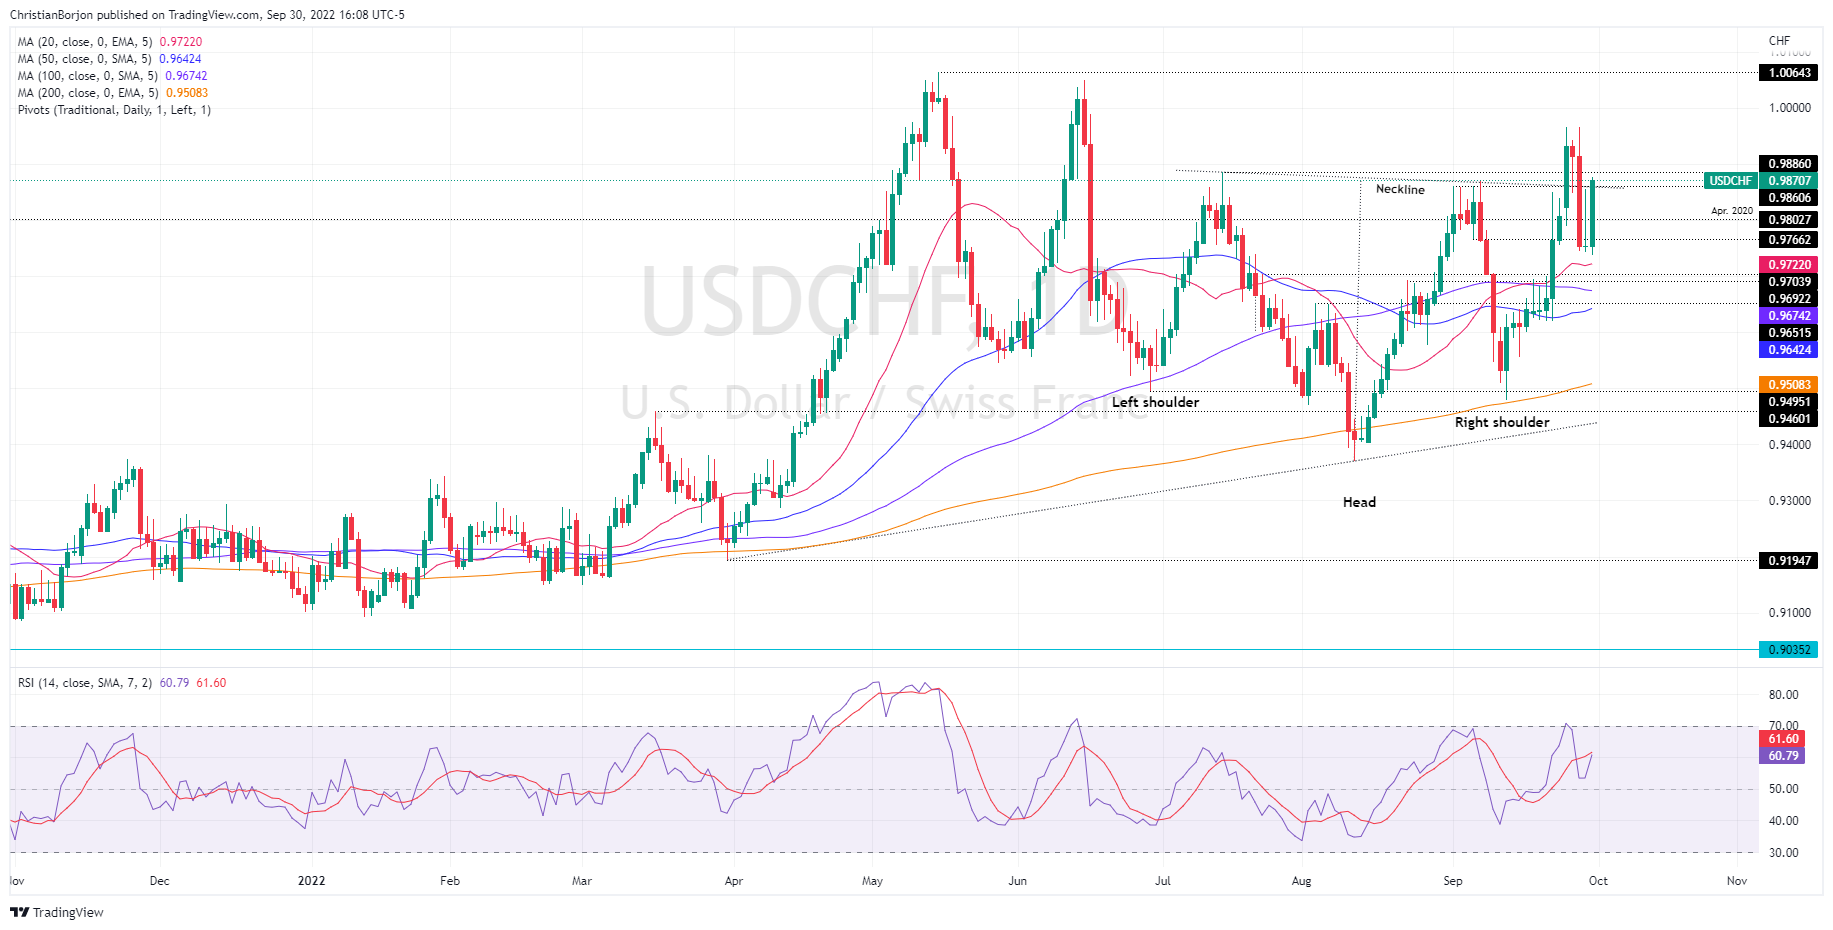
When reviewing the USD/CHF daily chart, the bias is also upward biased, and price action escalating above the “neckline” of an inverted head-and-shoulders chart pattern could pave the way for further gains. Oscillators are in positive territory, with the RSi at 60.79 about to cross above its 7-day RSI SMA, which would mean that buyers are gathering momentum, opening the door for further gains.

Therefore, the USD/CHF first resistance would be the 0.9900 figure. Break above will expose the September 28 high at 0.9965, followed by parity, and then the YTD high at 1.0064.

USD/CHF Key Technical Levels

USD/CHF

Overview
Today last price0.987
Today Daily Change0.0114
Today Daily Change %1.17
Today daily open0.9756
 
Trends
Daily SMA200.9723
Daily SMA500.9642
Daily SMA1000.9681
Daily SMA2000.9509
 
Levels
Previous Daily High0.9856
Previous Daily Low0.9753
Previous Weekly High0.9851
Previous Weekly Low0.962
Previous Monthly High0.9808
Previous Monthly Low0.9371
Daily Fibonacci 38.2%0.9792
Daily Fibonacci 61.8%0.9817
Daily Pivot Point S10.972
Daily Pivot Point S20.9685
Daily Pivot Point S30.9617
Daily Pivot Point R10.9824
Daily Pivot Point R20.9892
Daily Pivot Point R30.9927

Author

Christian Borjon Valencia

Christian Borjon began his career as a retail trader in 2010, mainly focused on technical analysis and strategies around it. He started as a swing trader, as he used to work in another industry unrelated to the financial markets.

More from Christian Borjon Valencia
Share:

Markets move fast. We move first.

Orange Juice Newsletter brings you expert driven insights - not headlines. Every day on your inbox.

By subscribing you agree to our Terms and conditions.

Editor's Picks

EUR/USD moves sideways below 1.1800 on Christmas Eve

EUR/USD struggles to find direction and trades in a narrow channel below 1.1800 after posting gains for two consecutive days. Bond and stock markets in the US will open at the usual time and close early on Christmas Eve, allowing the trading action to remain subdued. 

GBP/USD keeps range around 1.3500 amid quiet markets

GBP/USD keeps its range trade intact at around 1.3500 on Wednesday. The Pound Sterling holds the upper hand over the US Dollar amid pre-Christmas light trading as traders move to the sidelines heading into the holiday season. 

Gold retreats from record highs, trades below $4,500

Gold retreats after setting a new record-high above $4,520 earlier in the day and trades in a tight range below $4,500 as trading volumes thin out ahead of the Christmas break. The US Dollar selling bias remains unabated on the back of dovish Fed expectations, which continues to act as a tailwind for the bullion amid persistent geopolitical risks.

Bitcoin slips below $87,000 as ETF outflows intensify, whale participation declines

Bitcoin price continues to trade around $86,770 on Wednesday, after failing to break above the $90,000 resistance. US-listed spot ETFs record an outflow of $188.64 million on Tuesday, marking the fourth consecutive day of withdrawals.

Economic outlook 2026-2027 in advanced countries: Solidity test

After a year marked by global economic resilience and ending on a note of optimism, 2026 looks promising and could be a year of solid economic performance. In our baseline scenario, we expect most of the supportive factors at work in 2025 to continue to play a role in 2026.

Avalanche struggles near $12 as Grayscale files updated form for ETF

Avalanche trades close to $12 by press time on Wednesday, extending the nearly 2% drop from the previous day. Grayscale filed an updated form to convert its Avalanche-focused Trust into an ETF with the US Securities and Exchange Commission.