|

USD/CHF Price Analysis: Oversold RSI could test bears around 0.9370-55 support zone

  • USD/CHF extends week-start pullback towards the monthly low.
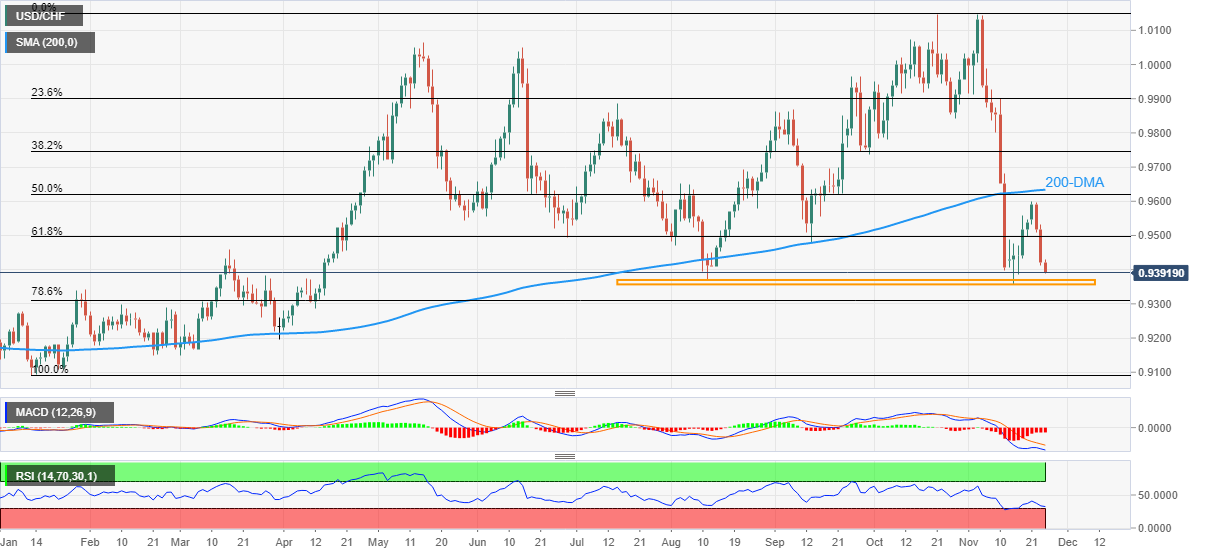
  • Three-month-old horizontal area challenges sellers amid oversold RSI, 200-DMA restricts buyer’s entry.
  • 61.8% and 78.6% Fibonacci retracement levels act as additional trading filters.

USD/CHF takes offers to refresh the weekly low near 0.9390 as sellers cheer the third consecutive daily fall heading into Thursday’s European session.

In doing so, the Swiss Franc (CHF) pair extends Tuesday‘s U-turn from 0.9600, as well as the previous day’s downside break of the 61.8% Fibonacci retracement level of January-November upside. That said, the bearish MACD signals add strength to the downside bias.

However, nearly oversold conditions of the Relative Strength Index (RSI), placed at 14, suggest limited downside room for the USD/CHF pair.

As a result, an area comprising lows marked during August and so far in November, around 0.9370-55, gains the major attention of the bears.

If at all the USD/CHF bears conquer the 0.9355 support, the 78.6% Fibonacci retracement level near 0.9310 and the 0.9300 round figure could act as additional downside filter to challenge the pair’s further declines.

On the contrary, March’s high of 0.9460 acts as an immediate upside hurdle for the USD/CHF bulls, a break of which could escalate the corrective bounce towards the 61.8% Fibonacci retracement level near 0.9500.

However, the pair buyers are likely to remain indecisive unless witnessing a clear upside break of the 200-DMA, around 0.9635, at the latest.

USD/CHF: Daily chart

Trend: Limited downside expected

Additional important levels

Overview
Today last price0.9392
Today Daily Change-0.0028
Today Daily Change %-0.30%
Today daily open0.942
 
Trends
Daily SMA200.9727
Daily SMA500.9816
Daily SMA1000.9731
Daily SMA2000.9633
 
Levels
Previous Daily High0.9533
Previous Daily Low0.9412
Previous Weekly High0.9558
Previous Weekly Low0.9357
Previous Monthly High1.0148
Previous Monthly Low0.9781
Daily Fibonacci 38.2%0.9459
Daily Fibonacci 61.8%0.9487
Daily Pivot Point S10.9377
Daily Pivot Point S20.9334
Daily Pivot Point S30.9256
Daily Pivot Point R10.9498
Daily Pivot Point R20.9576
Daily Pivot Point R30.9619

Author

Anil Panchal

Anil Panchal

FXStreet

Anil Panchal has nearly 15 years of experience in tracking financial markets. With a keen interest in macroeconomics, Anil aptly tracks global news/updates and stays well-informed about the global financial moves and their implications.

More from Anil Panchal
Share:

Markets move fast. We move first.

Orange Juice Newsletter brings you expert driven insights - not headlines. Every day on your inbox.

By subscribing you agree to our Terms and conditions.

Editor's Picks

EUR/USD edges above 1.1750 due to ECB-Fed policy divergence

EUR/USD has recovered its recent losses registered in the previous session, trading around 1.1760 during the Asian hours on Friday. Traders will likely observe Germany’s Manufacturing Purchasing Managers’ Index data later in the day.

GBP/USD gathers strength above 1.3450 on Fed rate cut bets, BoE's gradual policy path

The GBP/USD pair gathers strength to around 1.3480 during the early Asian session on Friday. Expectations of the US Federal Reserve rate cuts this year weigh on the US Dollar against the Pound Sterling. Philadelphia Fed President Anna Paulson is set to speak later on the weekend. 

Gold climbs to near $4,350 on Fed rate cut bets, geopolitical risks

Gold price rises to near $4,345 during the early Asian session on Friday. Gold finished 2025 with a significant rally, achieving an annual gain of around 65%, its biggest annual gain since 1979. The rally of the precious metal is bolstered by the prospect of further US interest rate cuts in 2026 and safe-haven flows.

Bitcoin, Ethereum and Ripple enter the New Year with breakout hopes

Bitcoin, Ethereum, and Ripple entered the new year trading at key technical levels on Friday, as traders seek fresh directional cues in January. With BTC locked in a tight range, ETH is approaching its 50-day Exponential Moving Average, while XRP is nearing resistance. A clear breakout across these top three cryptocurrencies could help define market momentum in the opening weeks of the year.

Economic outlook 2026-2027 in advanced countries: Solidity test

After a year marked by global economic resilience and ending on a note of optimism, 2026 looks promising and could be a year of solid economic performance. In our baseline scenario, we expect most of the supportive factors at work in 2025 to continue to play a role in 2026.

Crypto market outlook for 2026

Year 2025 was volatile, as crypto often is.  Among positive catalysts were favourable regulatory changes in the U.S., rise of Digital Asset Treasuries (DAT), adoption of AI and tokenization of Real-World-Assets (RWA).