• USD/CHF shows bullish momentum, targeting the 0.9100 mark with 0.27% gains.
  • RSI and three-day RoC indicators suggest bullish dominance despite sideways movement.
  • Overcoming the 0.9120 hurdles could steer the USD/CHF toward the 0.9147 and 0.9200 landmarks.

USD/CHF bounces off the 50-day Exponential Moving Average (EMA) and threatens to claim the 0.9100 figure late after Wall Street closed. The US Dollar (USD), propelled by risk aversion, helped the USD/CHF to Regusters solid gains of 0.27%. At the time of writing, the USD/CHF is trading at 0.9090 after hitting a low of 0.9043.

USD/CHF Price Analysis: Technical outlook

From the USD/CHF daily chart perspective, the pair is neutrally biased, consolidated within the limits of solid support found around the 20- and 50-day EMAs, each at 0.9036 and 0.9040) and resistance at the 100-day EMA at 0.9123. Although price action remains sideways, the Relative Strength Index (RSI) shows bulls are in charge, further cemented by the three-day Rate of Change (RoC). Hence, the USD/CHF path of least resistance is upwards. Of note, the Average True Range (ATR) suggests that volatility in the pair could lean up to 60 pips.

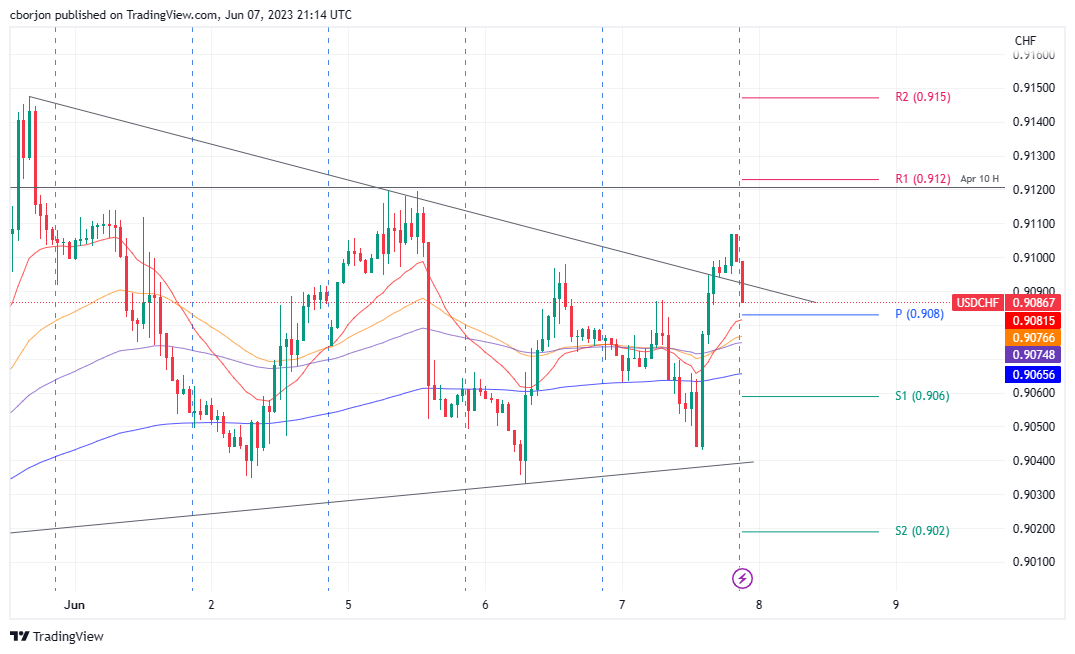
Dialing into the USD/CHF hourly chart, price action remains sideways, though it broke above a resistance trendline late in the New York session, exacerbating a rally above 0.9100. However, buyers must reclaim the weekly high of 0.9120, so they can pose a threat toward the last week’s high of 0.9128. The breach of those levels will pave the way towards the R1 daily pivot at 0.9147, ahead of challenging the 0.9200 figure. Conversely, a fall below the daily pivot at 0.9083 could open the door towards the EMAs at around 0.9074/76, followed by the 200-EMA at 0.9065.

USD/CHF Price Action – Hourly chart

USD/CHF Hourly chart

USD/CHF

Overview
Today last price 0.9102
Today Daily Change 0.0026
Today Daily Change % 0.29
Today daily open 0.9076
 
Trends
Daily SMA20 0.9021
Daily SMA50 0.8996
Daily SMA100 0.9124
Daily SMA200 0.9369
 
Levels
Previous Daily High 0.9098
Previous Daily Low 0.9034
Previous Weekly High 0.9148
Previous Weekly Low 0.9014
Previous Monthly High 0.9148
Previous Monthly Low 0.882
Daily Fibonacci 38.2% 0.9073
Daily Fibonacci 61.8% 0.9058
Daily Pivot Point S1 0.904
Daily Pivot Point S2 0.9005
Daily Pivot Point S3 0.8976
Daily Pivot Point R1 0.9105
Daily Pivot Point R2 0.9134
Daily Pivot Point R3 0.917


Share: Feed news

Information on these pages contains forward-looking statements that involve risks and uncertainties. Markets and instruments profiled on this page are for informational purposes only and should not in any way come across as a recommendation to buy or sell in these assets. You should do your own thorough research before making any investment decisions. FXStreet does not in any way guarantee that this information is free from mistakes, errors, or material misstatements. It also does not guarantee that this information is of a timely nature. Investing in Open Markets involves a great deal of risk, including the loss of all or a portion of your investment, as well as emotional distress. All risks, losses and costs associated with investing, including total loss of principal, are your responsibility. The views and opinions expressed in this article are those of the authors and do not necessarily reflect the official policy or position of FXStreet nor its advertisers. The author will not be held responsible for information that is found at the end of links posted on this page.

If not otherwise explicitly mentioned in the body of the article, at the time of writing, the author has no position in any stock mentioned in this article and no business relationship with any company mentioned. The author has not received compensation for writing this article, other than from FXStreet.

FXStreet and the author do not provide personalized recommendations. The author makes no representations as to the accuracy, completeness, or suitability of this information. FXStreet and the author will not be liable for any errors, omissions or any losses, injuries or damages arising from this information and its display or use. Errors and omissions excepted.

The author and FXStreet are not registered investment advisors and nothing in this article is intended to be investment advice.

Recommended content


Recommended content

Editors’ Picks

AUD/USD: Extra gains in the pipeline above 0.6520

AUD/USD: Extra gains in the pipeline above 0.6520

AUD/USD partially reversed Tuesday’s strong pullback and regained the 0.6500 barrier and beyond in response to the sharp post-FOMC pullback in the Greenback on Wednesday.

AUD/USD News

EUR/USD meets support around 1.0650

EUR/USD meets support around 1.0650

EUR/USD managed to surpass the key 1.0700 barrier in response to the intense retracement in the US Dollar in the wake of the Fed’s interest rate decision and Chair Powell’s press conference.

EUR/USD News

Gold prices skyrocketed as Powell’s words boosted the yellow metal

Gold prices skyrocketed as Powell’s words boosted the yellow metal

Gold prices rallied sharply above the $2,300 milestone on Wednesday after the Federal Reserve kept rates unchanged while announcing that it would diminish the pace of the balance sheet reduction. 

Gold News

Ethereum plunges outside key range briefly as US Dollar Index gains strength

Ethereum plunges outside key range briefly as US Dollar Index gains strength

Institutional whales appear to be dumping Ethereum after recent dip. Fed’s decision to leave rates unchanged appears to have helped ETH's price recover slightly. SEC Chair Gensler has misled Congress, considering recent revelations from  Consensys suit, says Congressman McHenry.

Read more

The FOMC whipsaw and more Yen intervention in focus

The FOMC whipsaw and more Yen intervention in focus

Market participants clung to every word uttered by Chair Powell as risk assets whipped around in a frenetic fashion during the afternoon US trading session.

Read more

Forex MAJORS

Cryptocurrencies

Signatures