|

USD/CHF Price Analysis: Further downside towards 0.8700 appears impulsive

  • USD/CHF remains pressured at weekly low, extends pullback from 50-DMA, key resistance line.
  • Downside break of monthly support line, looming bear cross on MACD also favor Swiss Franc pair sellers.
  • One-month-old horizontal support zone appears a tough nut to crack for bears.
  • Buyers need successful break of 0.8830 to retake control.

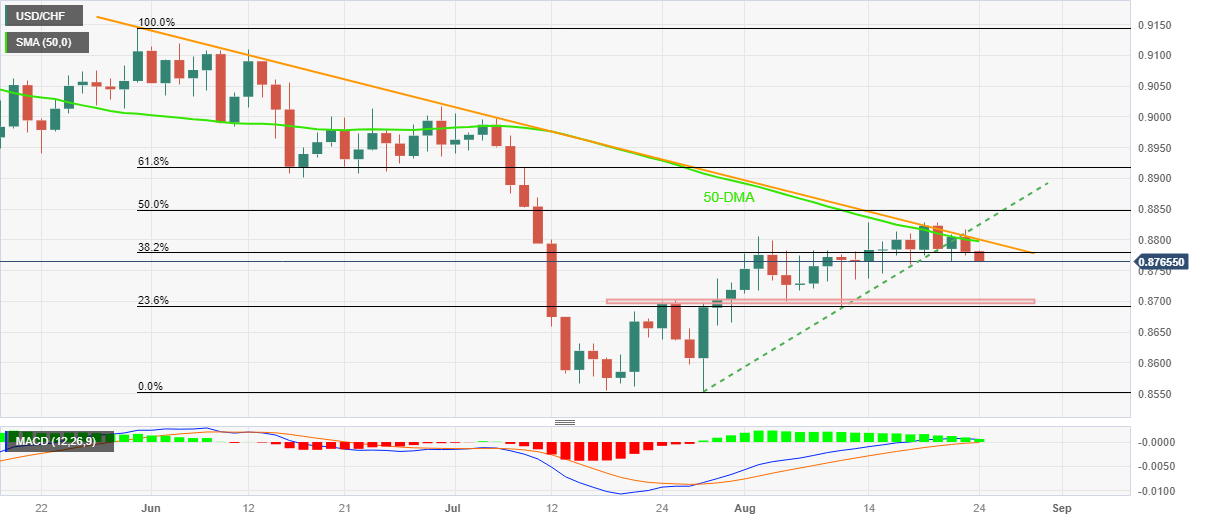
USD/CHF drops to the lowest level in a week while refreshing intraday bottom around 0.8765 heading into Thursday’s European session. In doing so, the Swiss Franc (CHF) pair prints a two-day losing streak by extending the previous day’s reversal from the 50-DMA and a three-month-old descending resistance line.

Not only the failure to cross the key DMA and trend line resistance but a sustained trading beneath the previous support line, which broke on Monday, joins the impending bear cross on the MACD indicator to also keep the USD/CHF sellers hopeful.

With this, the Swiss Franc (CHF) pair sellers approach a one-month-old horizontal support zone surrounding the 0.8700 threshold.

Following that, the 0.8635-30 region will act as the final defense of the USD/CHF buyers before pushing the traders toward the multi-year low marked in July around 0.8552.

Meanwhile, a convergence of the stated DMA and trend line, around 0.8805, restricts the immediate upside of the USD/CHF pair, a break of which could propel the quote towards the previous support line surrounding 0.8825.

However, the quote’s upside past 0.8825 needs validation from the double tops surrounding 0.8830.

Overall, the USD/CHF remains bearish but the room toward the south appears limited.

USD/CHF: Daily chart

Trend: Limited downside expected

Additional important levels

Overview
Today last price0.8765
Today Daily Change-0.0016
Today Daily Change %-0.18%
Today daily open0.8781
 
Trends
Daily SMA200.8762
Daily SMA500.8801
Daily SMA1000.8894
Daily SMA2000.909
 
Levels
Previous Daily High0.8817
Previous Daily Low0.8774
Previous Weekly High0.8828
Previous Weekly Low0.8738
Previous Monthly High0.9005
Previous Monthly Low0.8552
Daily Fibonacci 38.2%0.8791
Daily Fibonacci 61.8%0.8801
Daily Pivot Point S10.8764
Daily Pivot Point S20.8747
Daily Pivot Point S30.8721
Daily Pivot Point R10.8807
Daily Pivot Point R20.8834
Daily Pivot Point R30.8851

Author

Anil Panchal

Anil Panchal

FXStreet

Anil Panchal has nearly 15 years of experience in tracking financial markets. With a keen interest in macroeconomics, Anil aptly tracks global news/updates and stays well-informed about the global financial moves and their implications.

More from Anil Panchal
Share:

Markets move fast. We move first.

Orange Juice Newsletter brings you expert driven insights - not headlines. Every day on your inbox.

By subscribing you agree to our Terms and conditions.

Editor's Picks

EUR/USD edges above 1.1750 due to ECB-Fed policy divergence

EUR/USD has recovered its recent losses registered in the previous session, trading around 1.1760 during the Asian hours on Friday. Traders will likely observe Germany’s Manufacturing Purchasing Managers’ Index data later in the day.

GBP/USD gathers strength above 1.3450 on Fed rate cut bets, BoE's gradual policy path

The GBP/USD pair gathers strength to around 1.3480 during the early Asian session on Friday. Expectations of the US Federal Reserve rate cuts this year weigh on the US Dollar against the Pound Sterling. Philadelphia Fed President Anna Paulson is set to speak later on the weekend. 

Gold climbs to near $4,350 on Fed rate cut bets, geopolitical risks

Gold price rises to near $4,345 during the early Asian session on Friday. Gold finished 2025 with a significant rally, achieving an annual gain of around 65%, its biggest annual gain since 1979. The rally of the precious metal is bolstered by the prospect of further US interest rate cuts in 2026 and safe-haven flows.

Bitcoin, Ethereum and Ripple enter the New Year with breakout hopes

Bitcoin, Ethereum, and Ripple entered the new year trading at key technical levels on Friday, as traders seek fresh directional cues in January. With BTC locked in a tight range, ETH is approaching its 50-day Exponential Moving Average, while XRP is nearing resistance. A clear breakout across these top three cryptocurrencies could help define market momentum in the opening weeks of the year.

Economic outlook 2026-2027 in advanced countries: Solidity test

After a year marked by global economic resilience and ending on a note of optimism, 2026 looks promising and could be a year of solid economic performance. In our baseline scenario, we expect most of the supportive factors at work in 2025 to continue to play a role in 2026.

Crypto market outlook for 2026

Year 2025 was volatile, as crypto often is.  Among positive catalysts were favourable regulatory changes in the U.S., rise of Digital Asset Treasuries (DAT), adoption of AI and tokenization of Real-World-Assets (RWA).