|

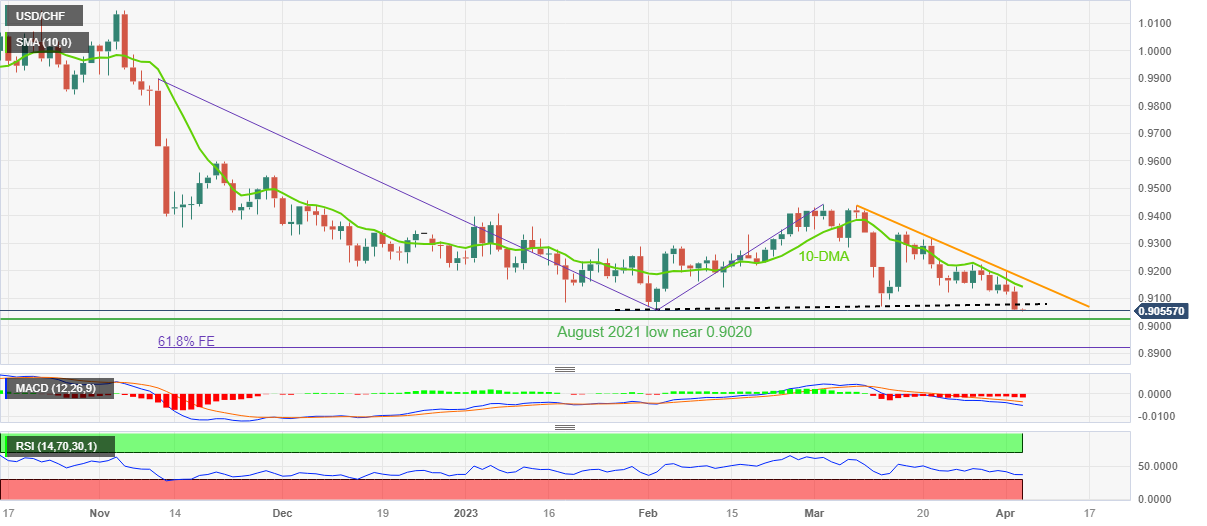
USD/CHF Price Analysis: Extends key support break to refresh 20-month low near 0.9050

  • USD/CHF holds lower grounds after refreshing multi-day bottom.
  • Downside break of two-month-old ascending trend line, bearish MACD signals favor sellers.
  • Oversold RSI highlights August 2021 low as nearby key support, 61.8% FE lures bears.
  • Buyers remain away unless the quote stays below 0.9180.

USD/CHF bears take a breather at the lowest levels since August 2021, making rounds to 0.9050 during early Wednesday.

The Swiss Franc (CHF) pair refreshed the multi-day low and portrayed a three-day downtrend earlier in Asia while justifying the previous day’s break of the key ascending support line from early February, now immediate resistance near 0.9080.

Adding strength to the downside bias are the bearish MACD signals and the quote’s one-month-old downward trajectory, as indicated by a descending resistance line from early March.

However, the RSI (14) inches close to the oversold territory and hence suggests the dip-buying, which in turn highlights the August 2021 bottom of around 0.9020 and the 0.9000 as the important supports.

Following that, the 61.8% Fibonacci Expansion (FE) of the pair’s moves between November 2022 and March 2023, around 0.8920, will be in focus.

Alternatively, the support-turned-resistance line challenges the USD/CHF pair’s immediate recovery moves around 0.9080, a break which can direct the buyers toward challenging the 10-DMA hurdle of 0.9145.

In a case where the USD/CHF remains firmer past 0.9145, the aforementioned one-month-old resistance line of near 0.9180 can act as the last defense of the bears.

USD/CHF: Daily chart
Trend: Further downside expected

Additional important levels

Overview
Today last price0.9055
Today Daily Change-0.0004
Today Daily Change %-0.04%
Today daily open0.9059
 
Trends
Daily SMA200.9208
Daily SMA500.9245
Daily SMA1000.9291
Daily SMA2000.9514
 
Levels
Previous Daily High0.9143
Previous Daily Low0.9055
Previous Weekly High0.9224
Previous Weekly Low0.9116
Previous Monthly High0.944
Previous Monthly Low0.9072
Daily Fibonacci 38.2%0.9089
Daily Fibonacci 61.8%0.9109
Daily Pivot Point S10.9028
Daily Pivot Point S20.8998
Daily Pivot Point S30.8941
Daily Pivot Point R10.9116
Daily Pivot Point R20.9174
Daily Pivot Point R30.9204

Author

Anil Panchal

Anil Panchal

FXStreet

Anil Panchal has nearly 15 years of experience in tracking financial markets. With a keen interest in macroeconomics, Anil aptly tracks global news/updates and stays well-informed about the global financial moves and their implications.


More from Anil Panchal
Share:

Editor's Picks

GBP/USD flat lines around mid-1.3300s amid Iran tensions

The GBP/USD pair struggles to capitalize on last week's strong move higher and oscillates in a narrow band, around the 1.3350 area during the Asian session on Monday. Moreover, spot prices remain below a technically significant 200-day Simple Moving Average, warranting caution before positioning for an extension of the recent recovery from the 1.3140 zone, or the year-to-date low touched in June.


EUR/USD: 20-day EMA acts as key barrier near 1.1460

The EUR/USD pair trades marginally lower to near 1.1428 during the early European trading session. The major currency pair faces slight selling pressure as the US Dollar gains ground after a negative weekly close. In the late Asian trade, the US Dollar Index trades 0.1% higher to near 101.00.

Gold struggles to find acceptance above $4,200; eases from two-week high

Gold struggles to capitalize on its modest Asian session uptick, and trades below a fresh two-week high, levels just above the $4,200 mark. The US Dollar attracts some safe-haven flows amid uncertainties stemming from tensions in the Strait of Hormuz, and acts as a headwind for the bullion. However, receding bets for rate hikes by the US Federal Reserve hold back USD bulls from placing aggressive bets.

Cardano Price Forecast: Bullish momentum persists as traders stay cautiously optimistic
Cardano (ADA) is trading slightly lower on Monday, finding support around the key technical level at $0.186. ADA pauses its gains at the start of this week after posting a massive 31% rally in the previous week. Despite the pullback, derivatives data suggests traders remain cautiously optimistic, while momentum indicators indicate that the uptrend remains intact if ADA holds the key support zone.
Why central banks are loading up on Gold during the current 30% correction
Gold has crashed from $5,500 to $4,000 in five months, marking a decline of almost 30% that has triggered widespread retail panic. However, this correction could present a significant opportunity, driven by an unprecedented market indicator: central bankers and the world's largest asset managers are aggressively buying.
Kevin Warsh offers no policy clues: Why markets still got their answer

Financial markets came to Sintra looking for clues about the Federal Reserve's (Fed) next move. They largely left with confirmation that Fed Chair Kevin Warsh intends to make those clues much harder to find.













