EUR/USD Price Forecast: 20-day EMA acts as key barrier near 1.1460
- EUR/USD edges down to near 1.1428 as the US Dollar rebounds.
- Investors await the FOMC Minutes for fresh cues regarding the US interest rate outlook.
- Cooling Eurozone core inflationary pressures have eased fears of more ECB interest rate hikes.

The EUR/USD pair trades marginally lower to near 1.1428 during the early European trading session on Monday. The major currency pair faces slight selling pressure as the US Dollar (USD) gains ground after a negative weekly close.
In the late Asian trade, the US Dollar Index (DXY), which gauges the Greenback’s value against six major currencies, trades 0.1% higher to near 101.00.
Last week, the US Dollar came under pressure after the release of the United States (US) Nonfarm Payrolls (NFP) data for June, which showed signs of moderate labor demand and forced traders to reconsider the Federal Reserve’s (Fed) interest rate hike expectations.
For fresh cues on the US interest rate outlook, investors await the Federal Open Market Committee (FOMC) Minutes of the June policy meeting, which will be released on Wednesday.
Though investors have underpinned the US Dollar against the Euro (EUR), the latter is outperforming its other peers despite easing fears of more interest rate hikes by the European Central Bank (ECB) this year.
Euro Price Today
The table below shows the percentage change of Euro (EUR) against listed major currencies today. Euro was the strongest against the New Zealand Dollar.
| USD | EUR | GBP | JPY | CAD | AUD | NZD | CHF | |
|---|---|---|---|---|---|---|---|---|
| USD | 0.03% | 0.06% | 0.36% | 0.06% | 0.10% | 0.40% | 0.12% | |
| EUR | -0.03% | 0.03% | 0.33% | 0.03% | 0.08% | 0.37% | 0.09% | |
| GBP | -0.06% | -0.03% | 0.28% | -0.03% | -0.00% | 0.34% | 0.07% | |
| JPY | -0.36% | -0.33% | -0.28% | -0.31% | -0.26% | 0.02% | -0.18% | |
| CAD | -0.06% | -0.03% | 0.03% | 0.31% | 0.02% | 0.35% | 0.09% | |
| AUD | -0.10% | -0.08% | 0.00% | 0.26% | -0.02% | 0.33% | 0.06% | |
| NZD | -0.40% | -0.37% | -0.34% | -0.02% | -0.35% | -0.33% | -0.28% | |
| CHF | -0.12% | -0.09% | -0.07% | 0.18% | -0.09% | -0.06% | 0.28% |
The heat map shows percentage changes of major currencies against each other. The base currency is picked from the left column, while the quote currency is picked from the top row. For example, if you pick the Euro from the left column and move along the horizontal line to the US Dollar, the percentage change displayed in the box will represent EUR (base)/USD (quote).
Traders will likely pare ECB hawkish bets as the Eurozone core Harmonized Index of Consumer Prices (HICP) has cooled down more-than-expected in June. Last week, the flash core HICP – which excludes volatile components like food, energy, alcohol, and tobacco – arrived lower at 2.4% from estimates and the previous reading of 2.6%.
EUR/USD technical analysis
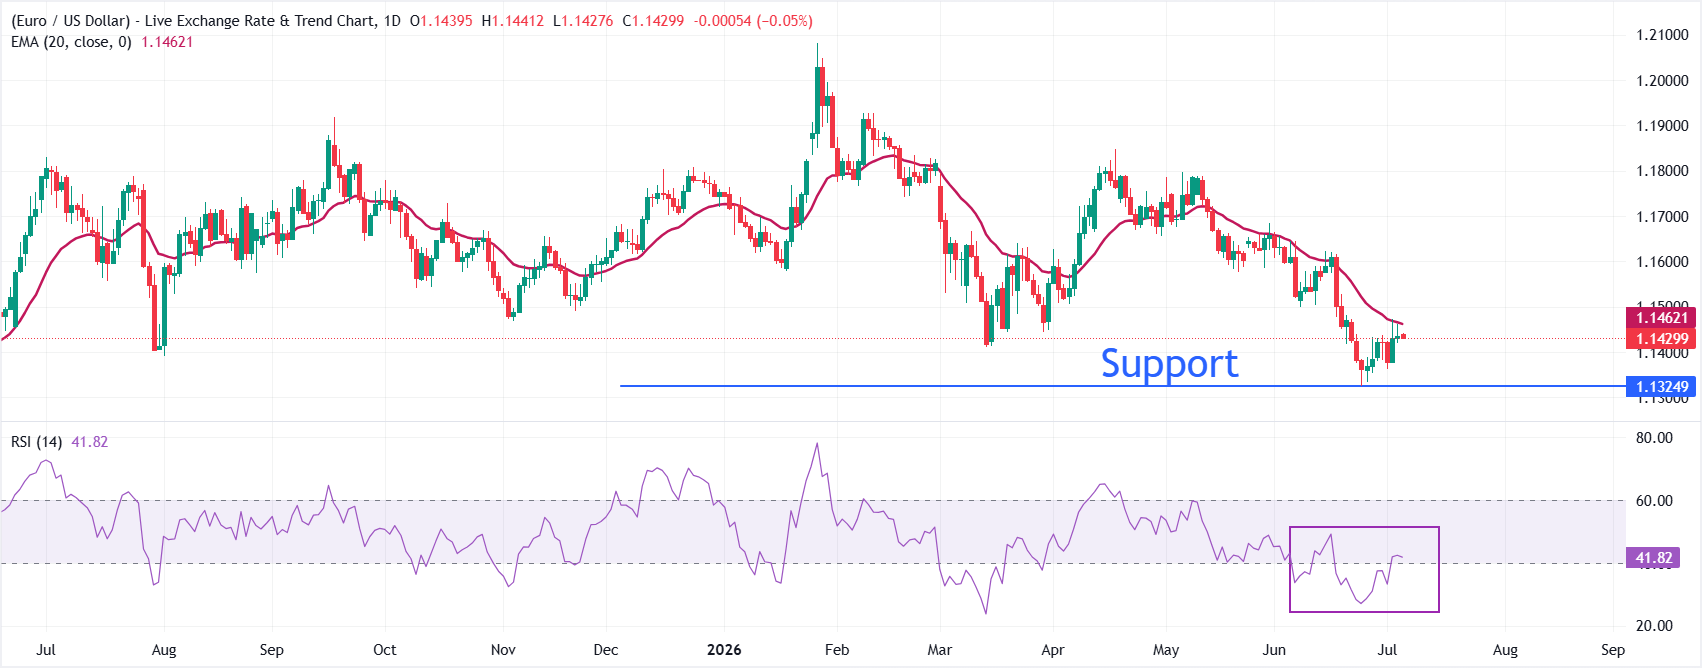
EUR/USD trades slightly lower at around 1.1430, maintaining a bearish near-term bias as the pair holds beneath the 20-day Exponential Moving Average (EMA) at 1.1462. The positioning below this key dynamic barrier suggests rallies remain capped for now, while the Relative Strength Index (RSI) near 42 hints at weak but stabilizing downside momentum rather than outright oversold conditions.
On the topside, initial resistance is defined by the 20-day EMA at 1.1462, and a daily close above this level would be needed to ease the current bearish pressure and open the door to a more sustained recovery. The major currency pair could rise to near 1.1500 if it breaks above the moving average. On the downside, the June 24 low at 1.1325 will be the key support zone; a break below this would expose it to 1.1300, followed by the 29 May 2025 low at 1.1210.
(The technical analysis of this story was written with the help of an AI tool.)
Economic Indicator
Core Harmonized Index of Consumer Prices (YoY)
The Core Harmonized Index of Consumer Prices (HICP) measures changes in the prices of a representative basket of goods and services in the European Monetary Union. The HICP, – released by Eurostat on a monthly basis, is harmonized because the same methodology is used across all member states and their contribution is weighted. The YoY reading compares prices in the reference month to a year earlier. Core HICP excludes volatile components like food, energy, alcohol, and tobacco. The Core HICP is a key indicator to measure inflation and changes in purchasing trends. Generally, a high reading is seen as bullish for the Euro (EUR), while a low reading is seen as bearish.
Read more.Last release: Wed Jul 01, 2026 09:00 (Prel)
Frequency: Monthly
Actual: 2.4%
Consensus: 2.6%
Previous: 2.6%
Source: Eurostat
Author

Sagar Dua
FXStreet
Sagar Dua is associated with the financial markets from his college days. Along with pursuing post-graduation in Commerce in 2014, he started his markets training with chart analysis.

















