|

USD/CHF Price Analysis: Buyers step in and lift the pair on sellers failure at the double top neckline

  • The USD/CHF to finish the week with decent gains of 0.39%.
  • Risk-aversion dominates Friday’s session, as throughout the whole week.
  • The USD/CHF double top in the daily chart is still in play, but failure at 0.9544, paves the way for further gains as buyers eye 0.9700.
  • In the near term, the major is upward biased, eyeing the 100-DMA.

The USD/CHF accelerates and reclaims the 0.9600 figure after harmful US economic data, showing that the economy, although expanding, is doing it at a slower pace than estimated amidst a US Federal Reserve tightening cycle. At the time of writing, the USD/CHF is trading at 0.9624.

US equities are falling, preparing to finish the week with substantial losses. Meanwhile, US Treasury yields have recovered some ground, while the greenback remains in the driver’s seat, as shown by the US Dollar index, up 0.58%, at 105.340.
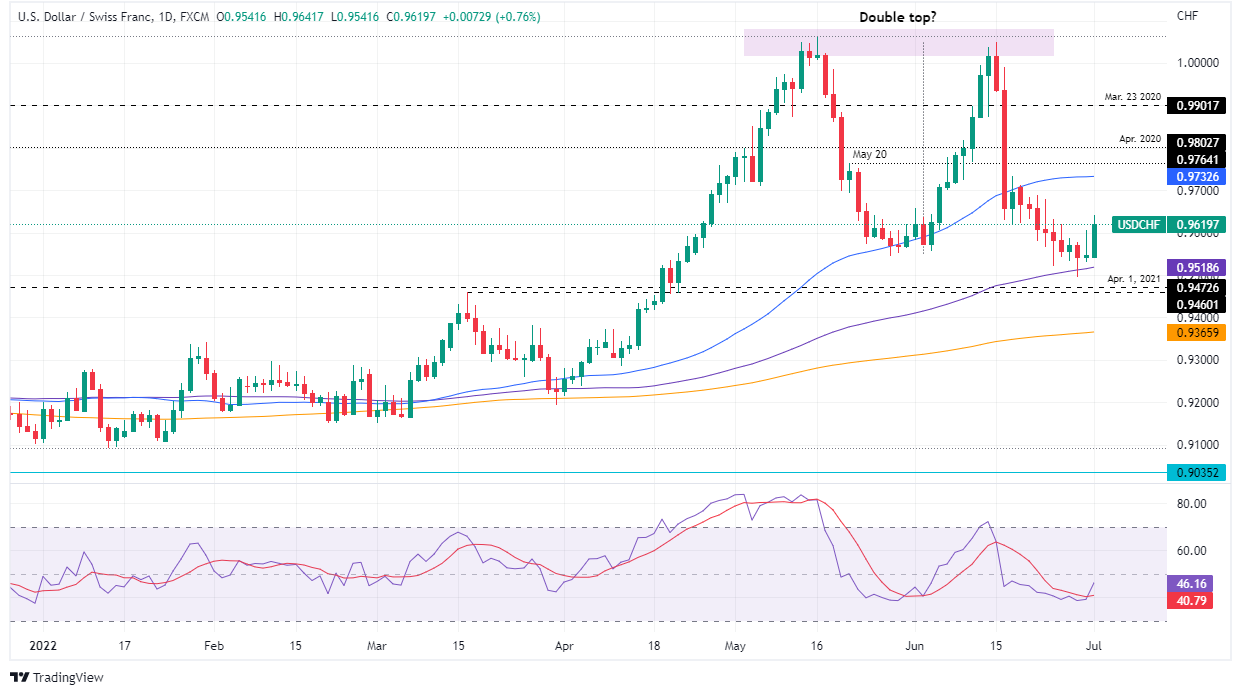
USD/CHF Daily chart

The USD/CHF regained some composture and is trading near the week highs around 0.9641. USD/CHF traders should note that sellers failed to break below the 100-day moving average (DMA) at 0.9518, exposing the pair to additional buying pressure. Also, the Relative Strenght Index (RSI) at 46 aimed upward and broke above the RSI’s 7-day moving average, meaning that buying pressure is mounting.

Therefore, the USD/CHF first resistance would be 0.9641. Break above would expose the 0.9700 mark, followed by the 50-DMA at 0.9732.

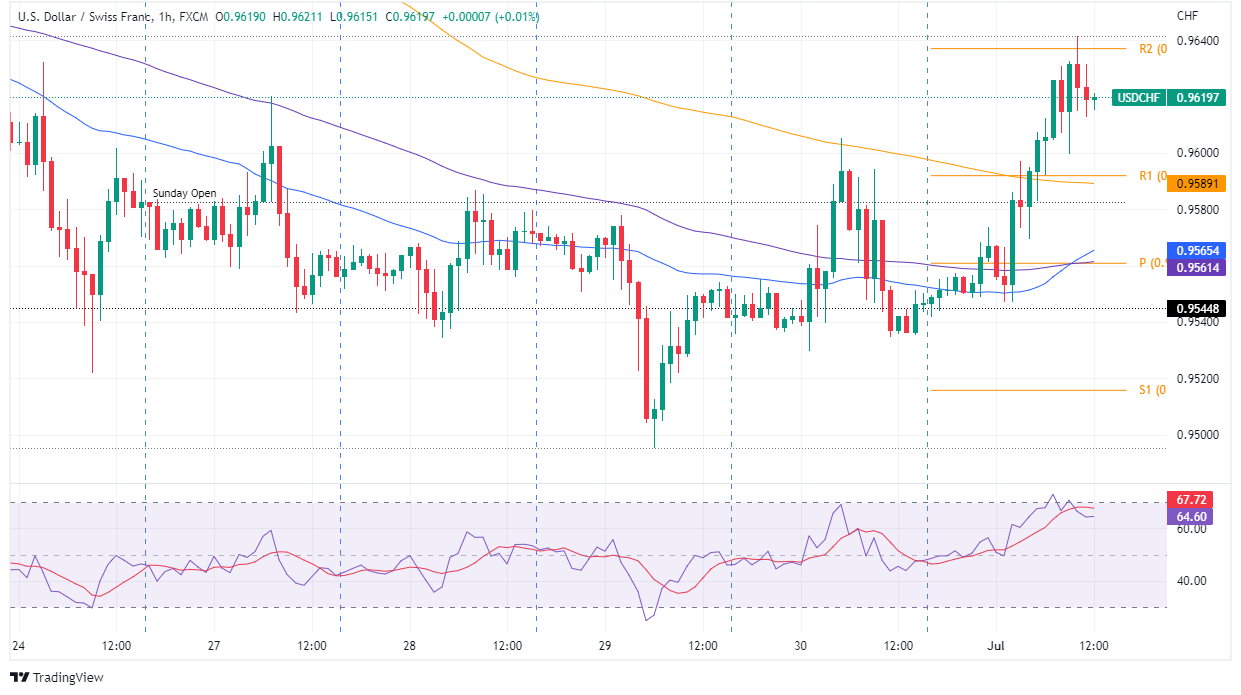
USD/CHF 1-Hour chart

In the 1-hour chart, the USD/CHF found its floor around 0.9500 on June 29, and since then, it has not looked back, achieving successive series of higher lows and higher highs, paving the way for further gains. It is worth noting that the major on its way north broke above the simple moving averages (SMAs), further cementing the case of recovery to the upside.

Hence, the USD/CHF first resistance will be the R2 daily pivot at 0.9640. A breach of the latter would expose the June 23 high at 0.9678, followed by the 0.9700 figure.

USD/CHF Key Technical Levels

USD/CHF

Overview
Today last price0.9619
Today Daily Change0.0072
Today Daily Change %0.75
Today daily open0.9547
 
Trends
Daily SMA200.9711
Daily SMA500.9736
Daily SMA1000.9519
Daily SMA2000.9368
 
Levels
Previous Daily High0.9605
Previous Daily Low0.953
Previous Weekly High0.9713
Previous Weekly Low0.9522
Previous Monthly High1.005
Previous Monthly Low0.9495
Daily Fibonacci 38.2%0.9559
Daily Fibonacci 61.8%0.9576
Daily Pivot Point S10.9516
Daily Pivot Point S20.9485
Daily Pivot Point S30.9441
Daily Pivot Point R10.9592
Daily Pivot Point R20.9636
Daily Pivot Point R30.9667

Author

Christian Borjon Valencia

Christian Borjon began his career as a retail trader in 2010, mainly focused on technical analysis and strategies around it. He started as a swing trader, as he used to work in another industry unrelated to the financial markets.

More from Christian Borjon Valencia
Share:

Markets move fast. We move first.

Orange Juice Newsletter brings you expert driven insights - not headlines. Every day on your inbox.

By subscribing you agree to our Terms and conditions.

Editor's Picks

EUR/USD off three-month highs, holds near 1.1800 on softer US Dollar

EUR/USD consolidates gains below 1.1800 in the European trading hours on Wednesday. A broadly subdued US Dollar continues to underpin the pair amid quiet markets and thin liquidity conditions on Christmas Eve. 

GBP/USD keeps range around 1.3500 amid quiet markets

GBP/USD keeps its range trade intact at around 1.3500 in the European session on Wednesday. The Pound Sterling holds the upper hand over the US Dollar amid pre-Christmas light trading as traders turn to sidelines heading into the holiday season. 

Gold retreats from record highs amid profit-taking on Christmas Eve

Gold retreats following the move higher to the $4,525 area, or a fresh all-time peak, though the downside remains limited amid a bullish fundamental backdrop. The US Dollar selling bias remains unabated on the back of dovish Fed expectations, which continues to act as a tailwind for the bullion amid persistent geopolitical risks.

Shiba Inu's bears tighten grip, aiming for yearly lows

Shiba Inu price remains under pressure, trading below $0.000070 on Wednesday as bearish momentum continues to dominate the broader crypto market. On-chain and derivatives data further support the bearish sentiment, while technical analysis suggests a deeper correction targeting the yearly lows.

Economic outlook 2026-2027 in advanced countries: Solidity test

After a year marked by global economic resilience and ending on a note of optimism, 2026 looks promising and could be a year of solid economic performance. In our baseline scenario, we expect most of the supportive factors at work in 2025 to continue to play a role in 2026.

Stellar Price Forecast: XLM slips below $0.22 as bearish momentum builds

Stellar (XLM) price is trading below $0.22 at the time of writing on Wednesday after failing to close above the key resistance earlier this week. Bearish momentum continues to strengthen, with open interest falling and short bets rising.