|

USD/CHF hovers below 0.9000: Is a breakout imminent?

  • USD/CHF trades at 0.8963, just shy of the key 0.9000 level, after gaining 4.50% from its year-to-date low.
  • Buyers aim to reclaim the 0.9000 psychological mark and the 200-day Moving Average at 0.9039 for further upside.
  • Downside risks emerge if the pair falls below the September 14 daily low of 0.8914, targeting the 0.8900 mark and the 50-DMA at 0.8774.

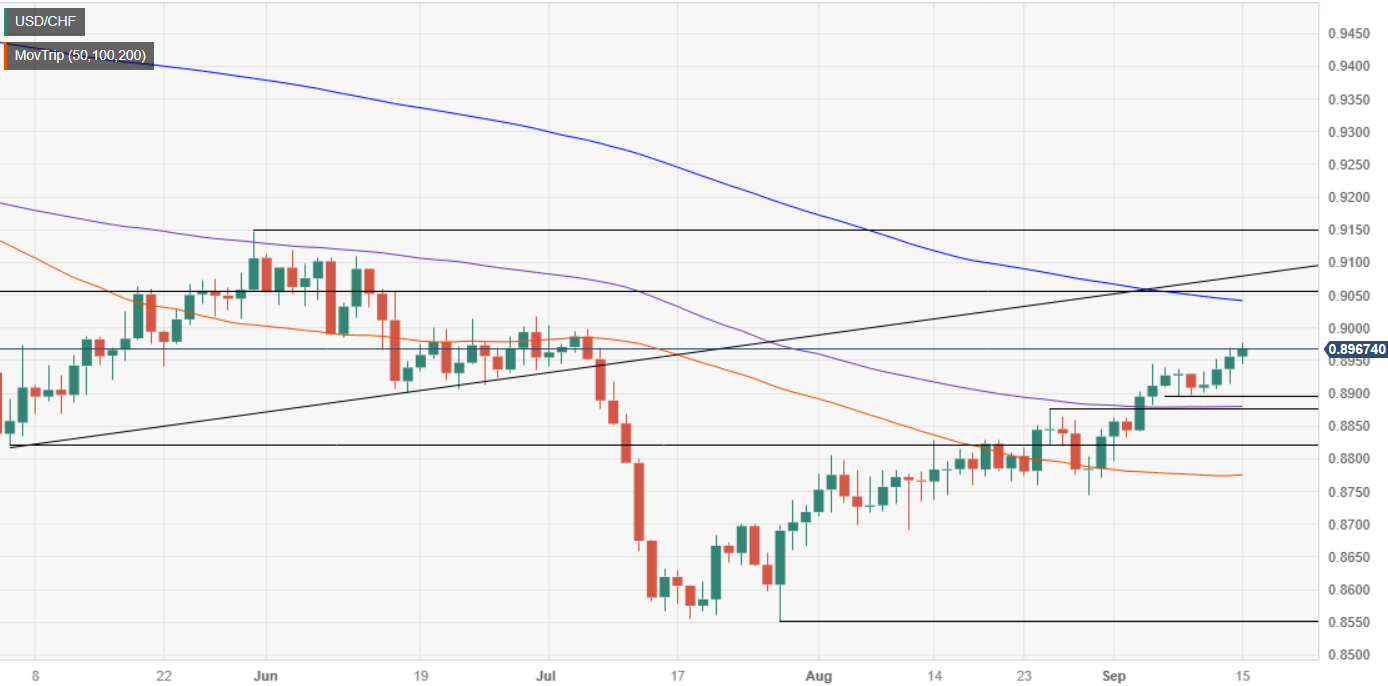
The USD/CHF extended its gains in the week to five consecutive days and printed a new two-month high at 0.8977, yet it remains shy of reclaiming the 0.9000 figure. Nevertheless, the pair is set to continue its uptrend and challenge the 200-day Moving Average (DMA() at 0.9039 once buyers reclaim 0.9000. At the time of writing, the major is trading at 0.8963 after hitting a daily low of 0.8944.

The daily chart portrays the pair’s recovery after printing a new year-to-date (YTD) low of 0.8552. Since then, the USD/CHF has achieved gains of 4.50% as buyers stepped in and lifted the exchange rate to current levels. Even though buyers reclaimed the 50-DMA at 0.8774, they remain shy of remaining in charge unless they reclaim the psychological 0.9000 figure, followed by the 200-DMA at 0.9039. Once those areas are cleared, the next test would be the May 31 high at 0.9147.

Conversely, if the USD/CHF drops below the September 14 daily low of 0.8914, that would exacerbate a challenge of the 0.8900 mark. A breach of the latter, and the pair could aim toward the current week’s low of 0.8893, followed by the 50-DMA at 0.8774.

USD/CHF Price Action – Daily chart

USD/CHF Technical Levels

USD/CHF

Overview
Today last price0.8962
Today Daily Change0.0006
Today Daily Change %0.07
Today daily open0.8956
 
Trends
Daily SMA200.886
Daily SMA500.8774
Daily SMA1000.888
Daily SMA2000.9044
 
Levels
Previous Daily High0.8971
Previous Daily Low0.8915
Previous Weekly High0.8945
Previous Weekly Low0.8833
Previous Monthly High0.8876
Previous Monthly Low0.869
Daily Fibonacci 38.2%0.8949
Daily Fibonacci 61.8%0.8936
Daily Pivot Point S10.8924
Daily Pivot Point S20.8891
Daily Pivot Point S30.8868
Daily Pivot Point R10.898
Daily Pivot Point R20.9003
Daily Pivot Point R30.9036

Author

Christian Borjon Valencia

Christian Borjon began his career as a retail trader in 2010, mainly focused on technical analysis and strategies around it. He started as a swing trader, as he used to work in another industry unrelated to the financial markets.

More from Christian Borjon Valencia
Share:

Markets move fast. We move first.

Orange Juice Newsletter brings you expert driven insights - not headlines. Every day on your inbox.

By subscribing you agree to our Terms and conditions.

Editor's Picks

EUR/USD moves sideways below 1.1800 on Christmas Eve

EUR/USD struggles to find direction and trades in a narrow channel below 1.1800 after posting gains for two consecutive days. Bond and stock markets in the US will open at the usual time and close early on Christmas Eve, allowing the trading action to remain subdued. 

GBP/USD keeps range around 1.3500 amid quiet markets

GBP/USD keeps its range trade intact at around 1.3500 on Wednesday. The Pound Sterling holds the upper hand over the US Dollar amid pre-Christmas light trading as traders move to the sidelines heading into the holiday season. 

Gold retreats from record highs, trades below $4,500

Gold retreats after setting a new record-high above $4,520 earlier in the day and trades in a tight range below $4,500 as trading volumes thin out ahead of the Christmas break. The US Dollar selling bias remains unabated on the back of dovish Fed expectations, which continues to act as a tailwind for the bullion amid persistent geopolitical risks.

Bitcoin slips below $87,000 as ETF outflows intensify, whale participation declines

Bitcoin price continues to trade around $86,770 on Wednesday, after failing to break above the $90,000 resistance. US-listed spot ETFs record an outflow of $188.64 million on Tuesday, marking the fourth consecutive day of withdrawals.

Economic outlook 2026-2027 in advanced countries: Solidity test

After a year marked by global economic resilience and ending on a note of optimism, 2026 looks promising and could be a year of solid economic performance. In our baseline scenario, we expect most of the supportive factors at work in 2025 to continue to play a role in 2026.

Avalanche struggles near $12 as Grayscale files updated form for ETF

Avalanche trades close to $12 by press time on Wednesday, extending the nearly 2% drop from the previous day. Grayscale filed an updated form to convert its Avalanche-focused Trust into an ETF with the US Securities and Exchange Commission.