USD/CAD Technical Analysis: Mission Accomplished as Greenback bulls hit the 1.3300 figure

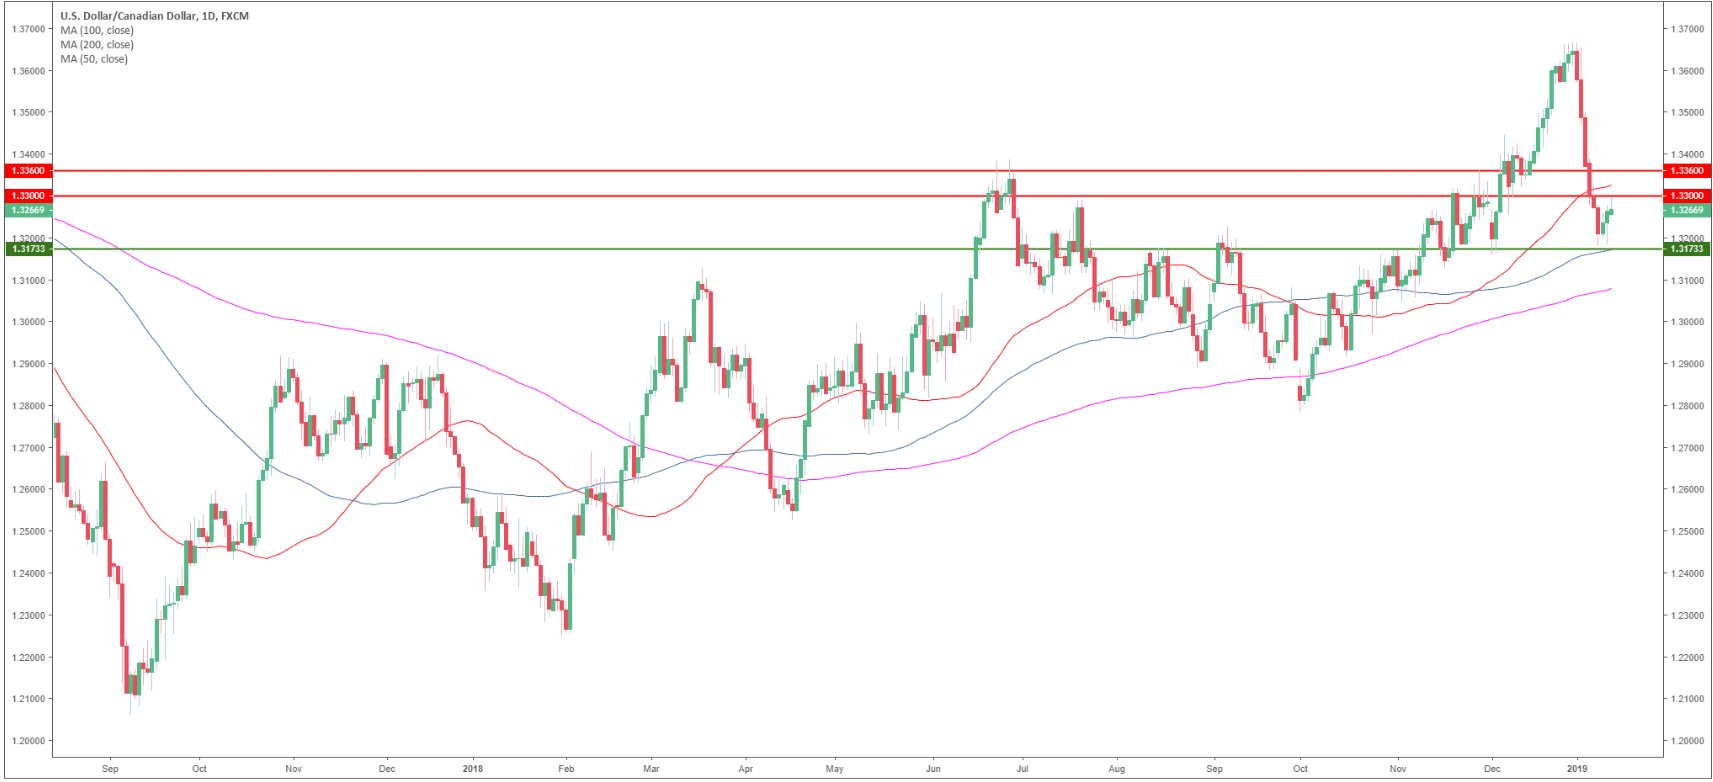
USD/CAD daily chart
- USD/CAD is trading in a bull trend above the 200-period simple moving average (SMA).
- As forecast USD/CAD reached the 1.3300 figure.
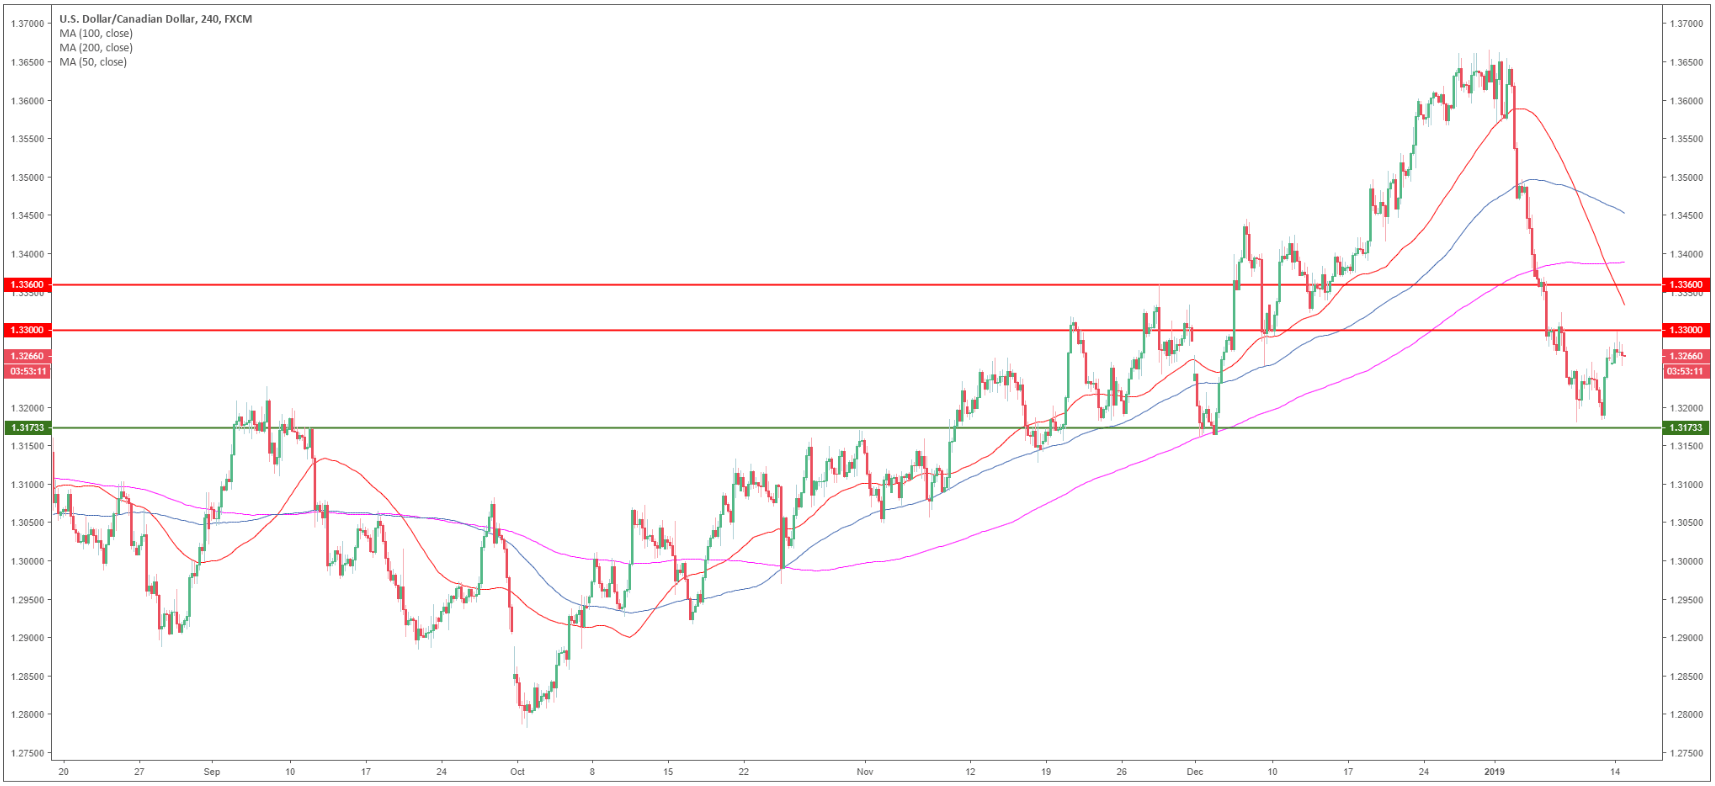
USD/CAD 4-hour chart
- USD/CAD is trading below its main SMAs.
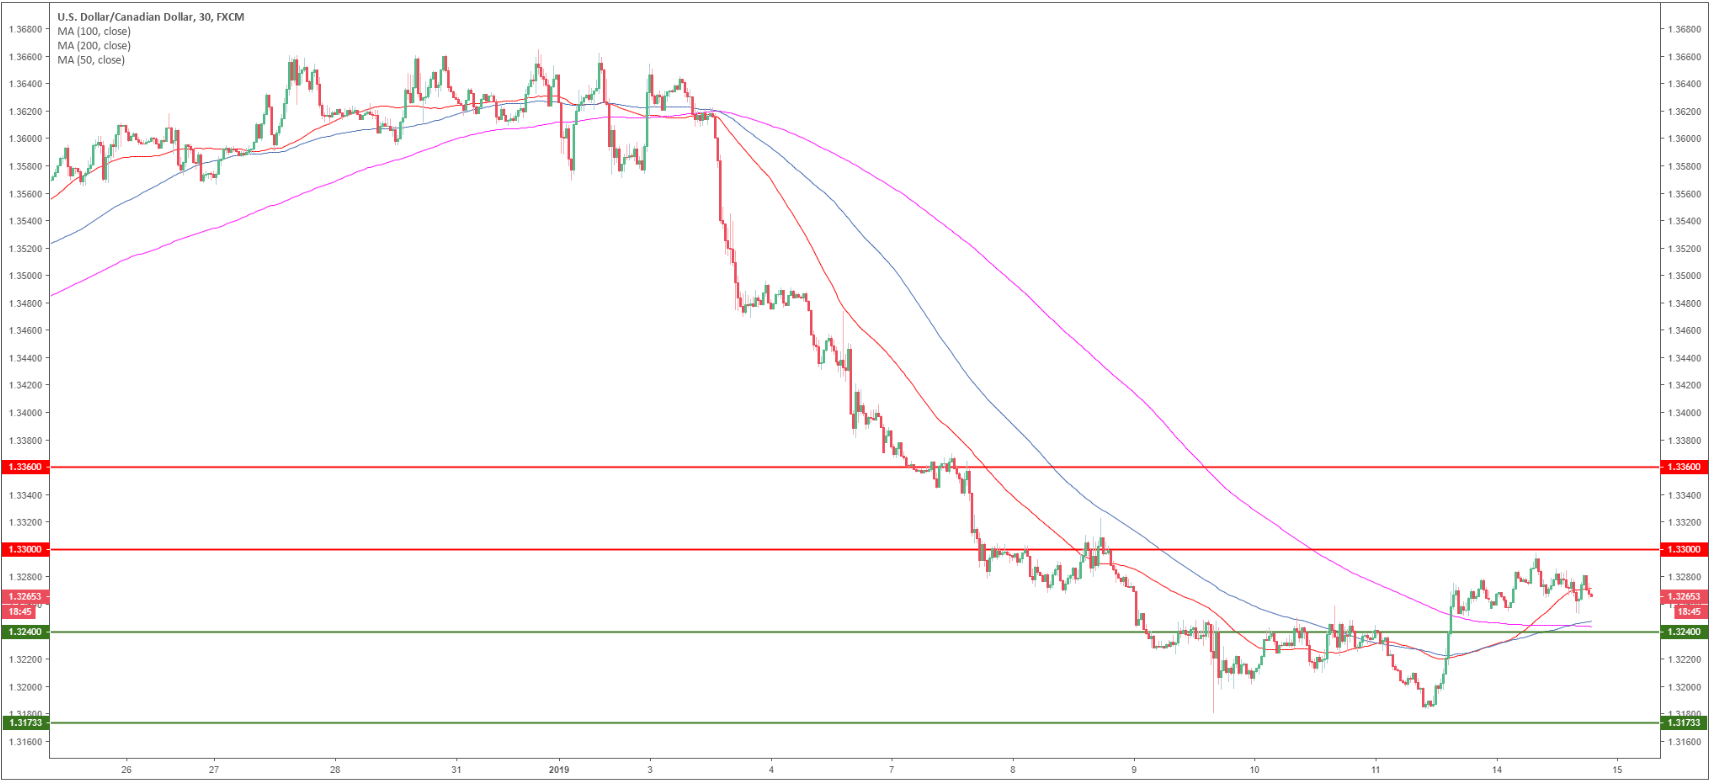
USD/CAD 30-minute chart
- USD/CAD is trading above its main 100 and 200 SMAs.
- USD/CAD might have entered a consolidation with support seen at the 1.3240 level.
- If bulls manage to break the 1.3300 resistance then traders should expect a run to 1.3360 target.
Additional key levels
USD/CAD
Overview:
Today Last Price: 1.3264
Today Daily change: -7.0 pips
Today Daily change %: -0.0527%
Today Daily Open: 1.3271
Trends:
Previous Daily SMA20: 1.3503
Previous Daily SMA50: 1.3356
Previous Daily SMA100: 1.3187
Previous Daily SMA200: 1.3086
Levels:
Previous Daily High: 1.328
Previous Daily Low: 1.3182
Previous Weekly High: 1.339
Previous Weekly Low: 1.318
Previous Monthly High: 1.4134
Previous Monthly Low: 1.316
Previous Daily Fibonacci 38.2%: 1.3242
Previous Daily Fibonacci 61.8%: 1.322
Previous Daily Pivot Point S1: 1.3209
Previous Daily Pivot Point S2: 1.3147
Previous Daily Pivot Point S3: 1.3112
Previous Daily Pivot Point R1: 1.3306
Previous Daily Pivot Point R2: 1.3341
Previous Daily Pivot Point R3: 1.3403
Author

Flavio Tosti
Independent Analyst


