USD/CAD Technical Analysis: Greenback hits 1.3240 target as DXY strengthens across the board

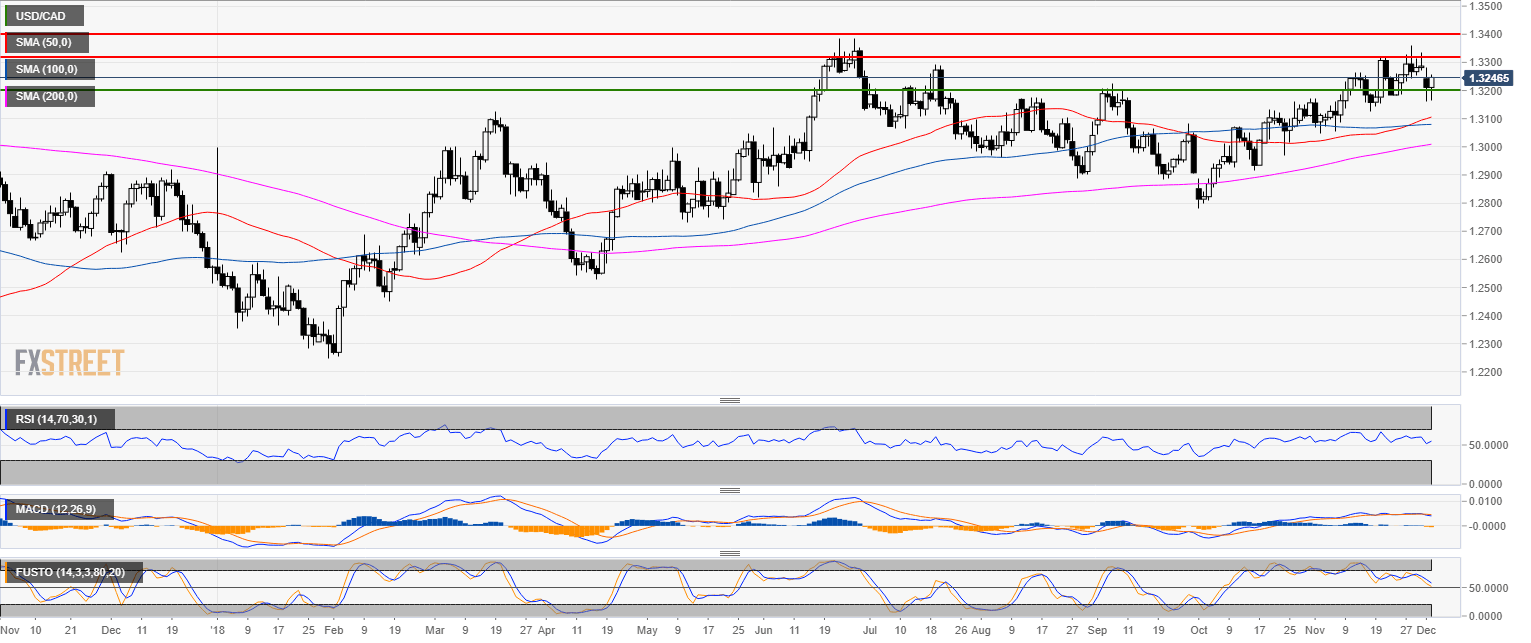
USD/CAD daily chart
- USD/CAD is trading in a bull trend below the 200-day simple moving average (SMA).
- USD/CAD hit the 1.3240 target as forecast.
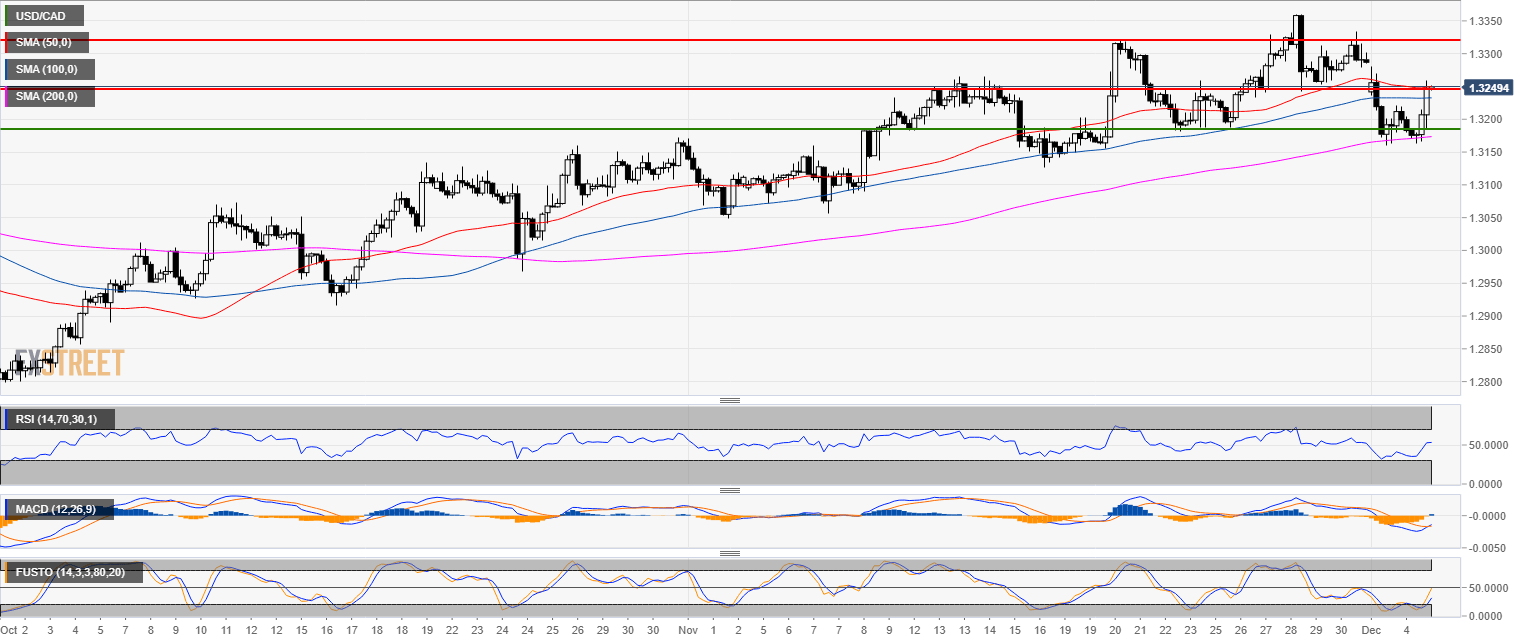
USD/CAD 4-hour chart
- USD/CAD is finding some resistance at the 50 SMA and near the 1.3240 level.
- Technical indicators such as RSI and MACD are picking up steam but Stochastic is still below the 50 line.
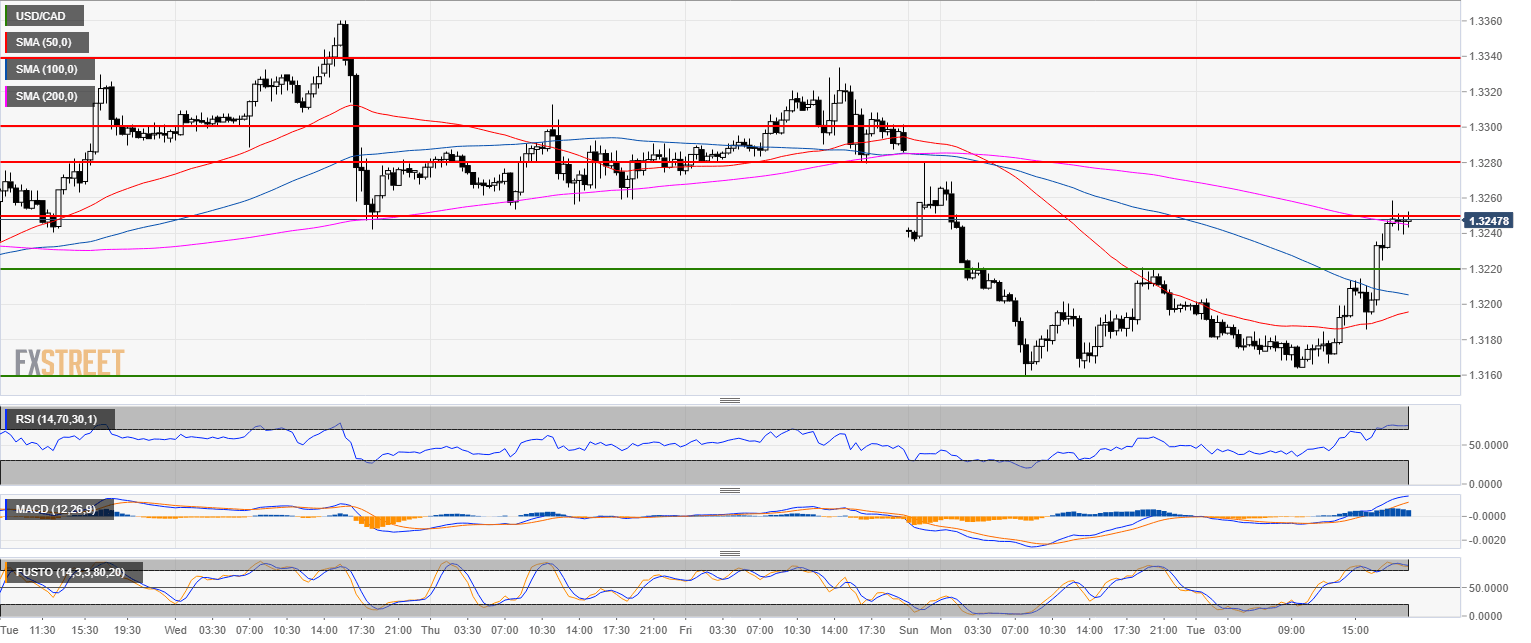
USD/CAD 30-minute chart
- On smaller time-frames, the level to beat for bulls is 1.3250 and the 200 SMA. Failure to break above 1.3250 can lead to a pullback to 1.3220 in the short-term.
- Ultimately, the bull target is 1.3300 figure.
Additional key levels
USD/CAD
Overview:
Today Last Price: 1.3248
Today Daily change: 37 pips
Today Daily change %: 0.280%
Today Daily Open: 1.3211
Trends:
Previous Daily SMA20: 1.3221
Previous Daily SMA50: 1.31
Previous Daily SMA100: 1.3079
Previous Daily SMA200: 1.3003
Levels:
Previous Daily High: 1.328
Previous Daily Low: 1.316
Previous Weekly High: 1.336
Previous Weekly Low: 1.3187
Previous Monthly High: 1.336
Previous Monthly Low: 1.3048
Previous Daily Fibonacci 38.2%: 1.3206
Previous Daily Fibonacci 61.8%: 1.3234
Previous Daily Pivot Point S1: 1.3154
Previous Daily Pivot Point S2: 1.3096
Previous Daily Pivot Point S3: 1.3033
Previous Daily Pivot Point R1: 1.3275
Previous Daily Pivot Point R2: 1.3338
Previous Daily Pivot Point R3: 1.3396
Author

Flavio Tosti
Independent Analyst


