|
USD/CAD technical analysis: Greenback challenging daily highs near 1.3150 as crude oil fall
- USD/CAD is steady above 1.3130 support as crude oil is down.
- The levels to beat for buyers are at 1.3158 and 1.3180.

Crude oil falls sharply as Kuwait and Saudi Arabia look to resume production in Neutral Zone
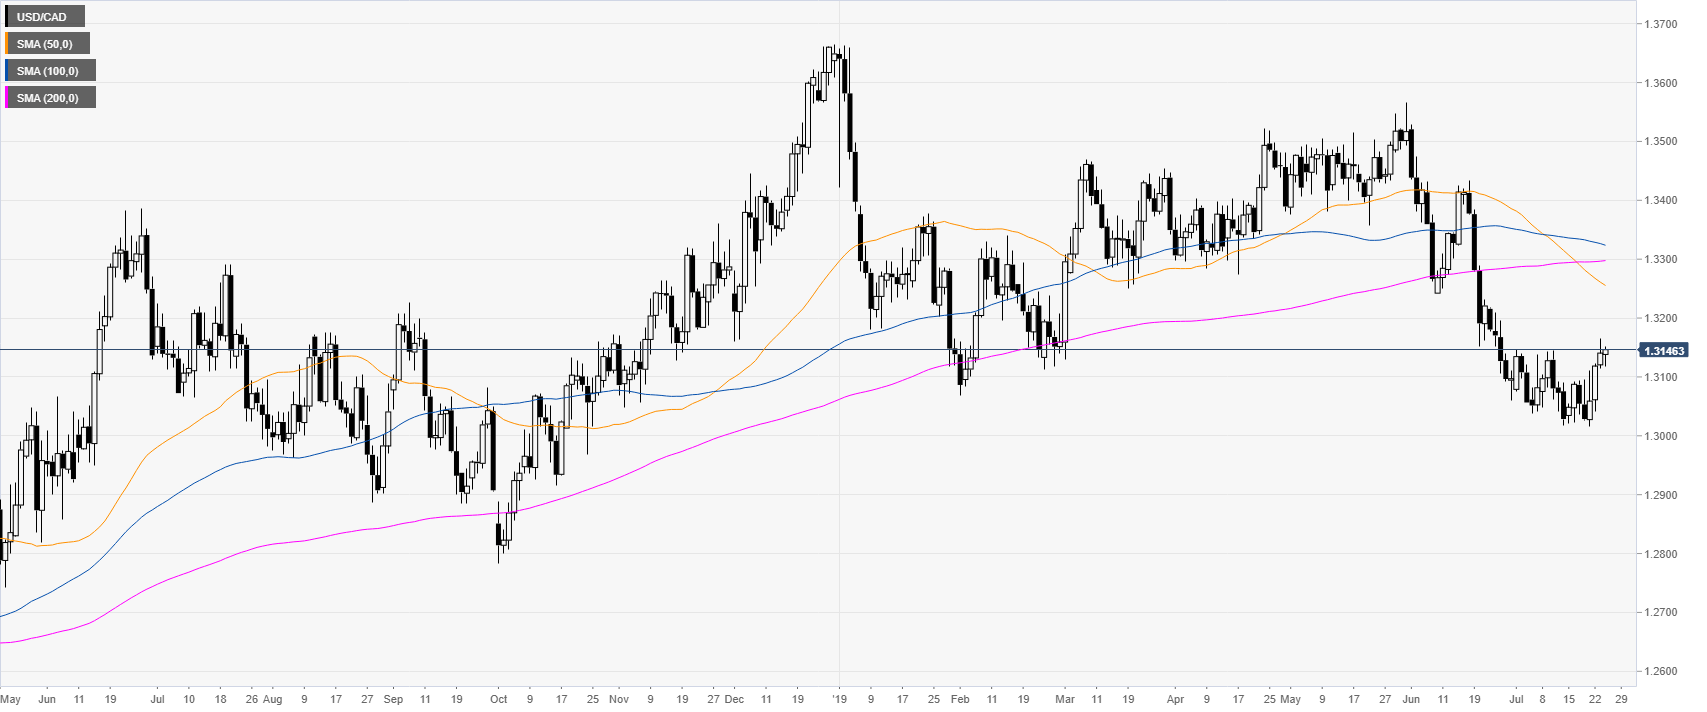
USD/CAD daily chart
USD/CAD is advancing above the 1.3100 figure while trading below its main daily simple moving averages (DSMAs). Oil is down giving USD/CAD a boost.
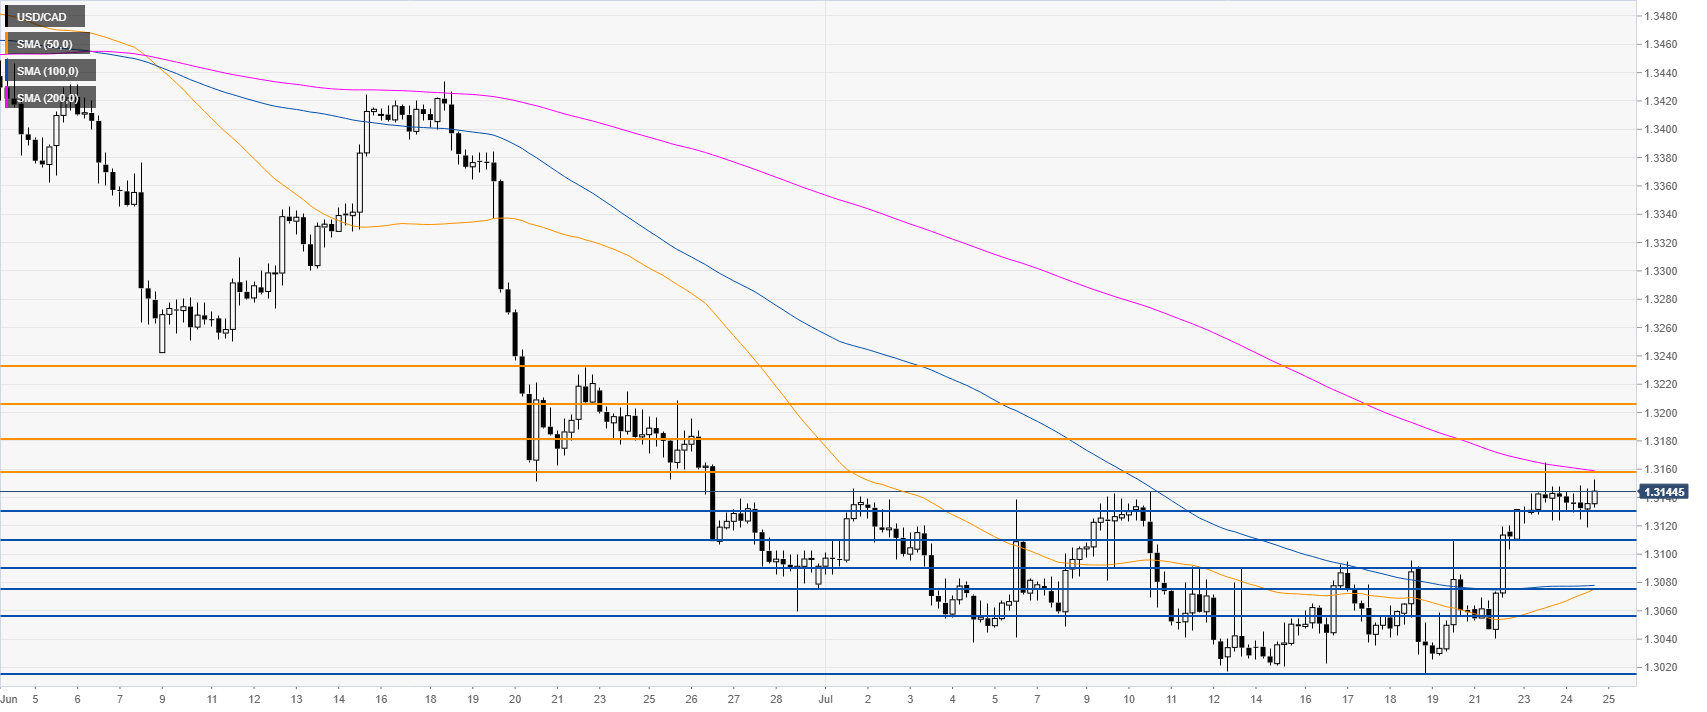
USD/CAD 4-hour chart
USD/CAD is testing the 1.3158 resistance as well as the 200 SMA. A break above the resistance level could lead to 1.3180, 1.3205 and 1.3232 resistances, according to the Technical Confluences Indicator.
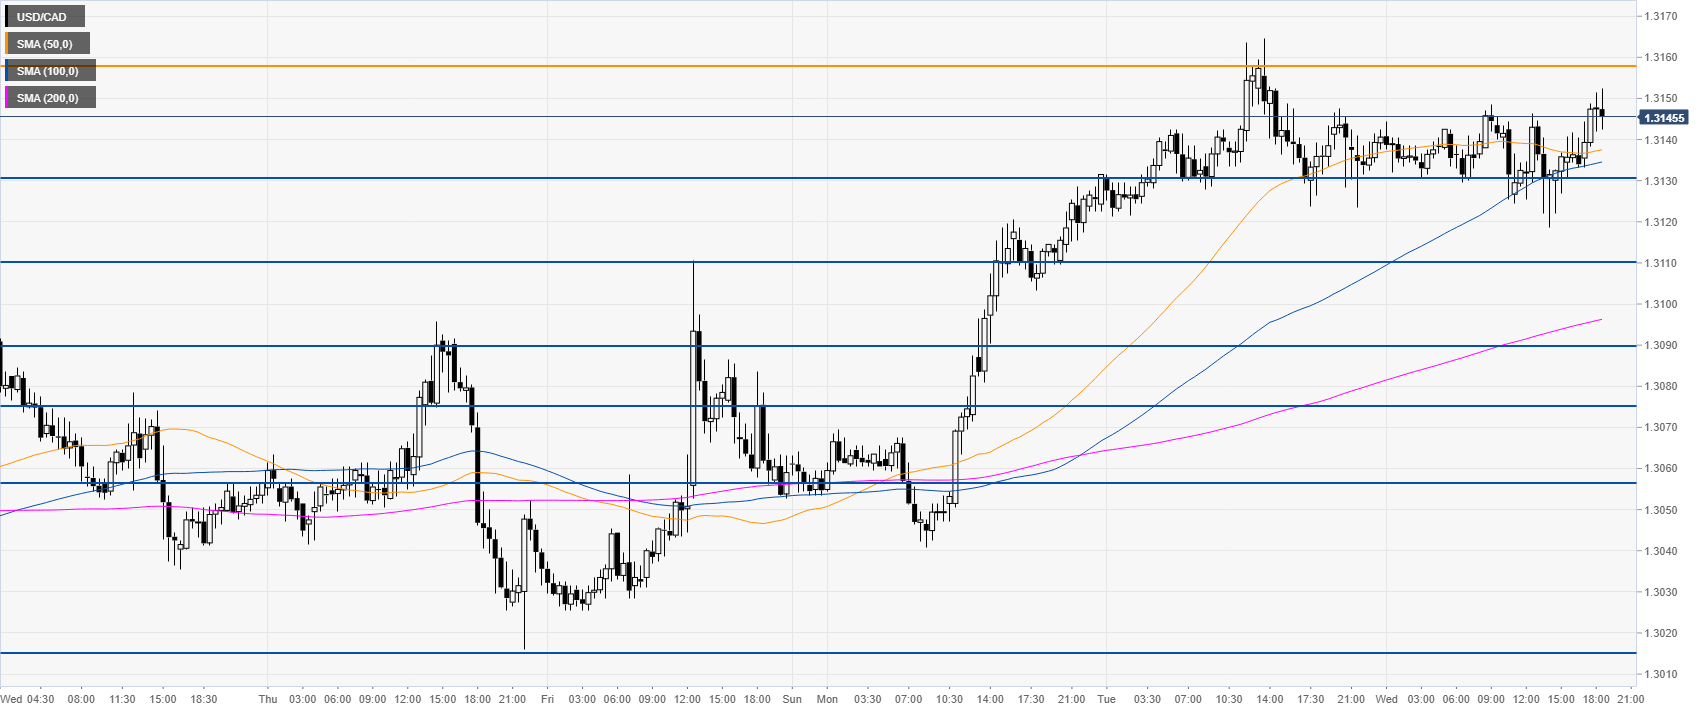
USD/CAD 30-minute chart
USD/CAD is trading above the main SMAs suggesting a bullish bias in the near term. Immediate support can be seen at 1.3130 and 1.3110, according to the Technical Confluences Indicator.

Additional key levels
Author

Flavio Tosti
Independent Analyst
More from Flavio Tosti


