|

USD/CAD Technical Analysis: Greenback bulls will lift the market to 1.3360 resistance
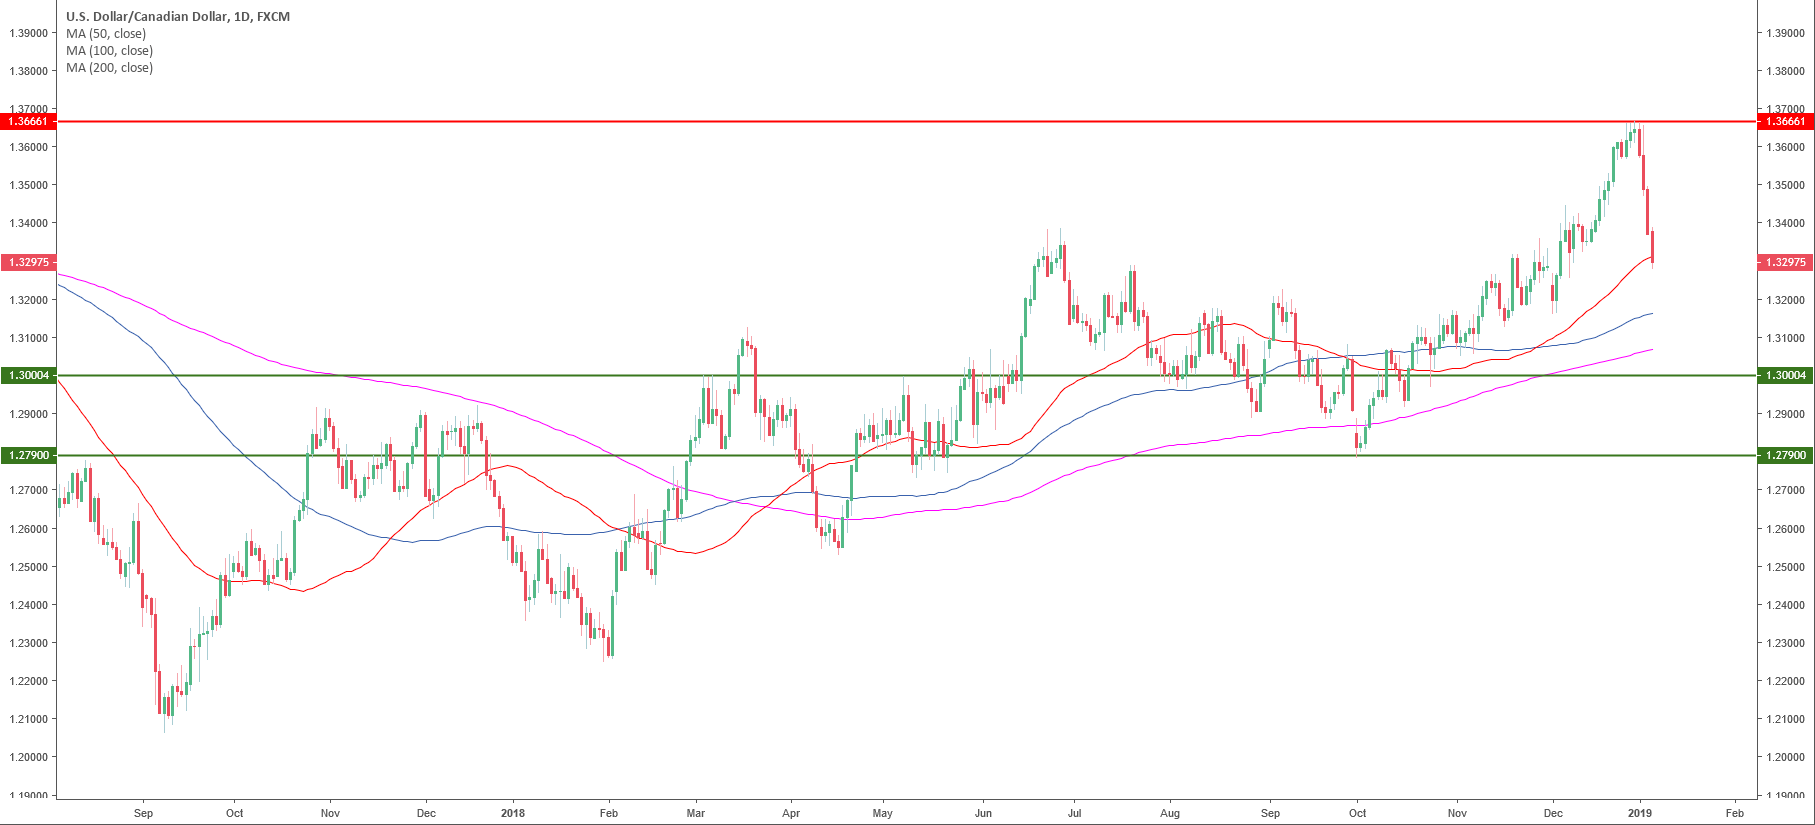
USD/CAD daily chart

  • USD/CAD is trading in a bull trend above the 100 and 200-period simple moving averages (SMAs).  
  • USD/CAD is having a deep pullback to the 50 SMA. 

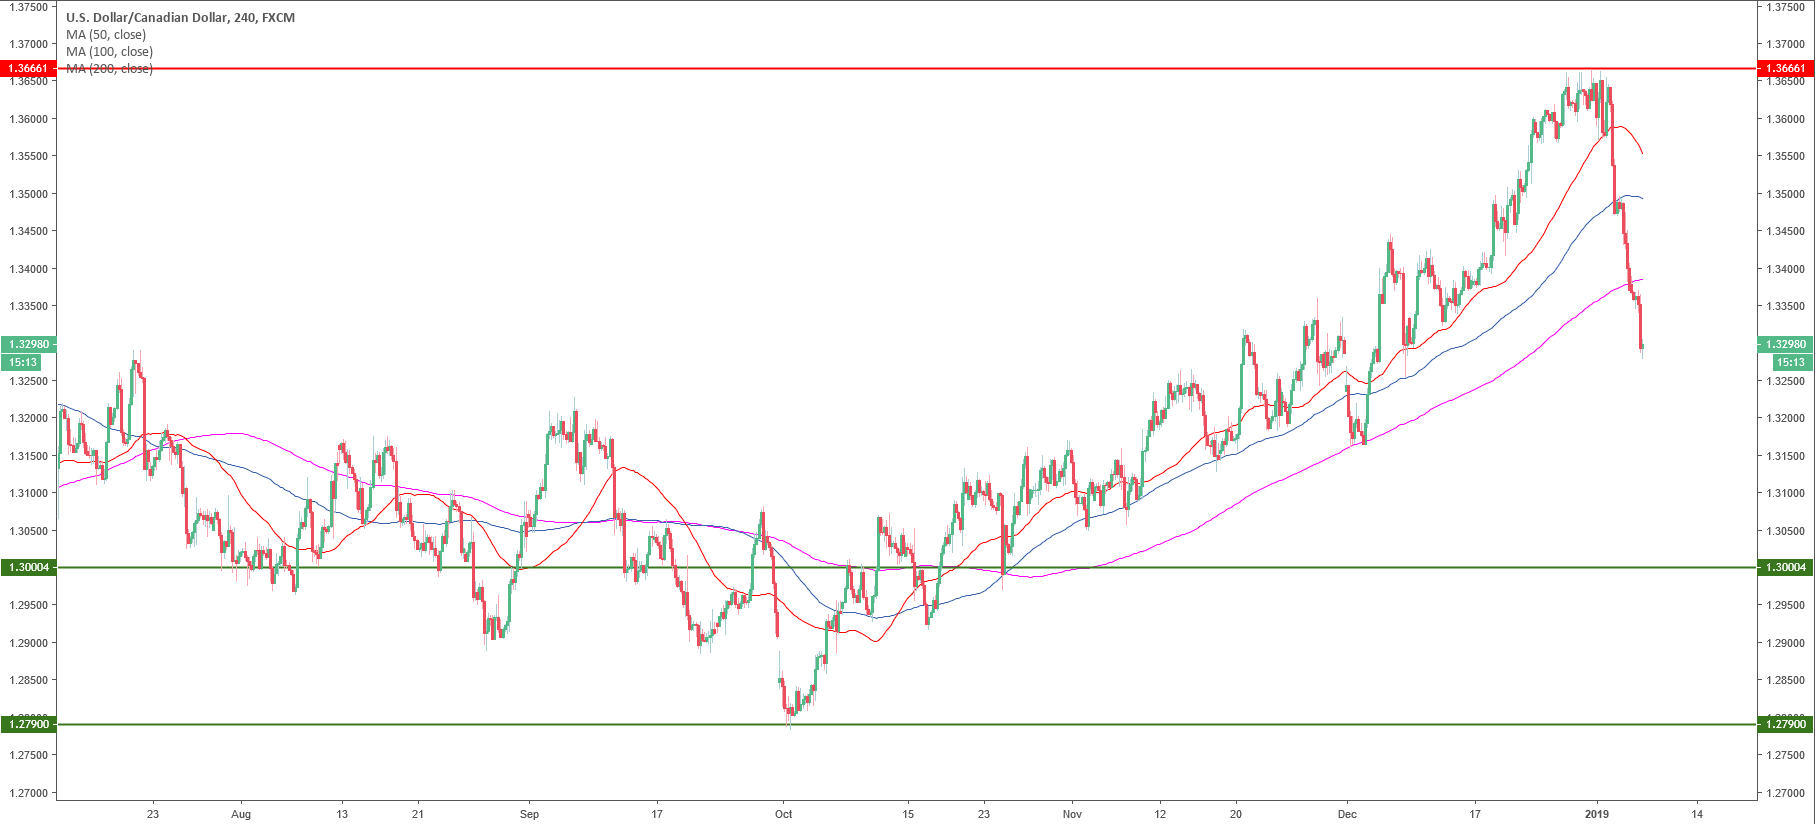
USD/CAD 4-hour chart

  • USD/CAD broke below its main SMAs.

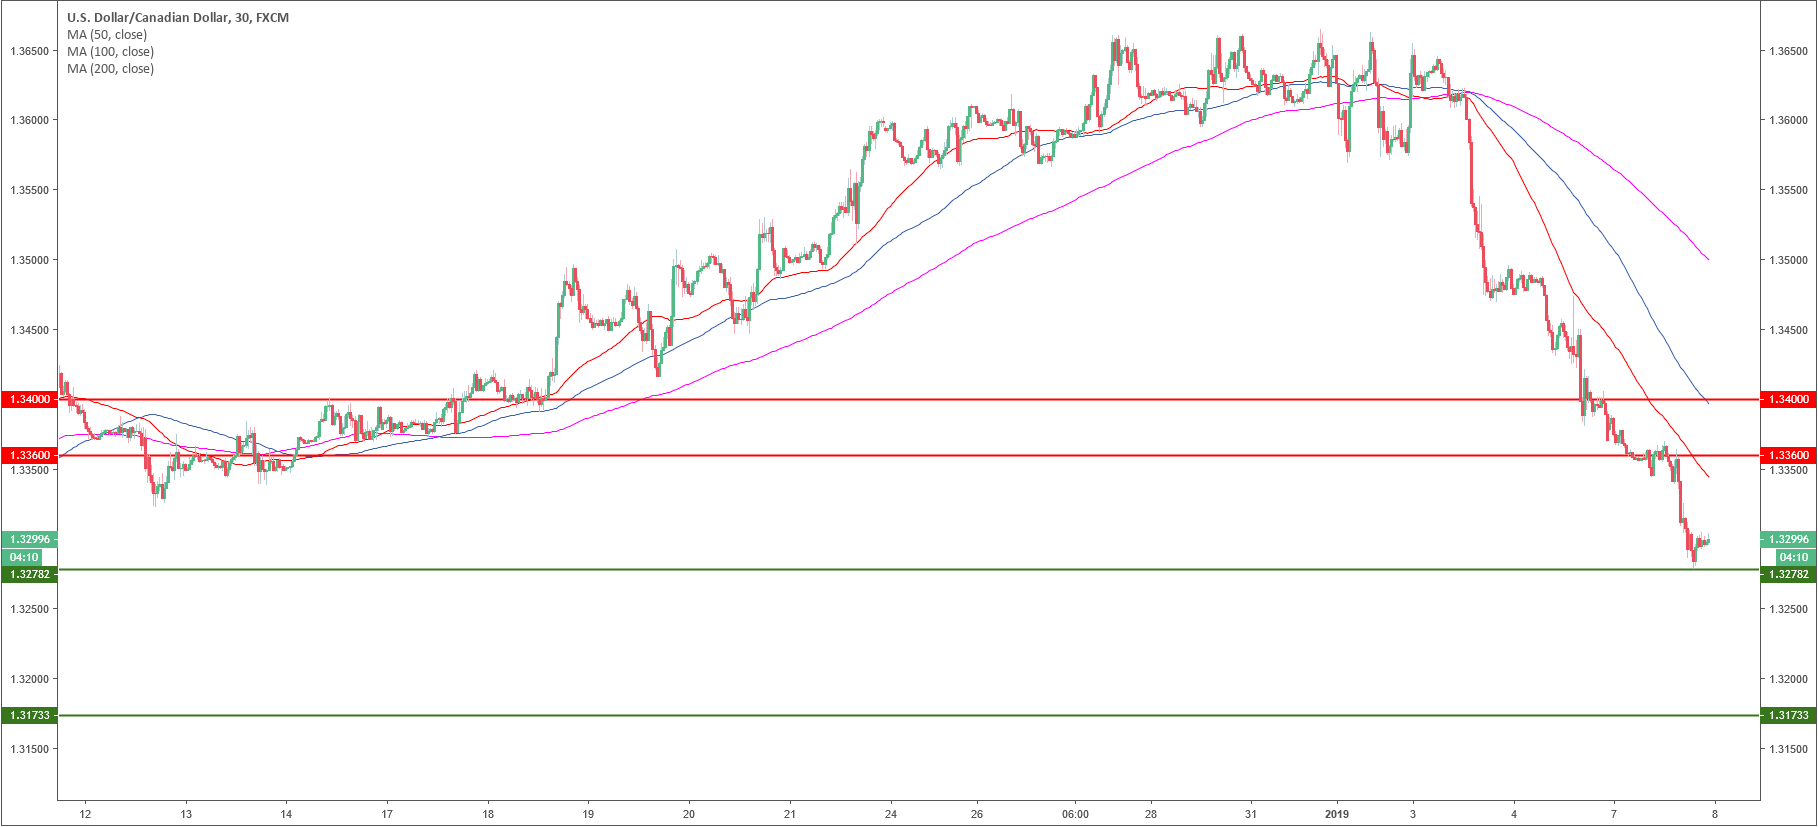
USD/CAD 30-minute chart

  • USD/CAD is trading below its main SMAs but 1.3280 is likely to act as strong support. 
  • Therefore 1.3360 and 1.3400 are most likely the next targets with a possible run up to the 1.3420 level.
  • A bear break below 1.3280 can lead to a drop to 1.3173. 

Additional key levels

USD/CAD

Overview:
    Today Last Price: 1.3299
    Today Daily change: -99 pips
    Today Daily change %: -0.739%
    Today Daily Open: 1.3398
Trends:
    Previous Daily SMA20: 1.3533
    Previous Daily SMA50: 1.3342
    Previous Daily SMA100: 1.3177
    Previous Daily SMA200: 1.3076
Levels:
    Previous Daily High: 1.3498
    Previous Daily Low: 1.338
    Previous Weekly High: 1.3666
    Previous Weekly Low: 1.338
    Previous Monthly High: 1.4134
    Previous Monthly Low: 1.316
    Previous Daily Fibonacci 38.2%: 1.3425
    Previous Daily Fibonacci 61.8%: 1.3453
    Previous Daily Pivot Point S1: 1.3353
    Previous Daily Pivot Point S2: 1.3308
    Previous Daily Pivot Point S3: 1.3236
    Previous Daily Pivot Point R1: 1.347
    Previous Daily Pivot Point R2: 1.3542
    Previous Daily Pivot Point R3: 1.3587

Author

Flavio Tosti

Flavio Tosti

Independent Analyst


More from Flavio Tosti
Share:

Editor's Picks

EUR/USD looks weak below 1.1800

EUR/USD has slipped back under pressure, breaking through the 1.1800 support and drifting towards the weekly lows near 1.1770 ahead of the opening bell in Asia. The move reflects renewed strength in the US Dollar, with steady geopolitical tensions keeping its demand firm. Moving forward, the release of the German labour market report and flash inflation figures should keep European investors entertained on Friday.
 

GBP/USD threatens the 200-day SMA near 1.3440

GBP/USD rapidly leaves behind Wednesday’s strong advance, coming under heavy pressure and retesting the 1.3440 zone, where the critical 200-day SMA is located. Cable’s deep pullback follows the strong gains in the Greenback, while investors continue to pencil in a potential BoE rate cut in March.

Gold trims gains, slips back to around $5,170

Gold is now facing some downside pressure, hovering around the $5,170 region on Thursday. The yellow metal surrenders part of its earlier gains on the back of the resurgence of the buying interest in the Greenback. In the meantime, geopolitical tensions in the Middle East continue to limit the downside potential for now.

How AI, blockchain, stablecoins are shaping a new global economy – Circle CEO Jeremy Allaire

Artificial Intelligence (AI), blockchain technology and stablecoins are emerging as core pillars of a new global economic system, according to Circle’s CEO, Jeremy Allaire.

Changing the game: International implications of recent tariff developments

The Supreme Court ruling on International Emergency Economic Powers Act (IEEPA) tariffs provides limited relief for the rest of the world, with weighted average tariff rates modestly lower.

Bitcoin steadies as traders eye US–Iran talks

Bitcoin (BTC) price is stabilizing around $68,000 at the time of writing on Thursday after a 6.2% relief rally the previous day amid a broader downward trend.