|

USD/CAD retreats as the US economy cools down

  • USD/CAD fell to 1.3530, tallying losses for the second day.
  • Investors dumped the USD as its economy showed signs of cooling down.
  • A hike by the Fed remains on the table, but rate cuts are seen sooner.

In the middle of the week, the USD was one of the worst performers in the FX markets, driven by soft ADP Employment figures and downward revisions of the Gross Domestic Product (GDP) annualised rate. On the CAD’s side, no relevant data was released as investors' eyes are on Friday’s Q2 GDP figures revisions from Canada.

The GDP annualised growth rates figures from the United States was revised lower to 2.1%, while the ADP Employment Change figures missed the consensus in August. They showed that the US economy added 177,000 figures, lower than the 195,000 expected and the previous 371,000. The cooling economy evidence remained investors that Jerome Powell stated last Friday that the Federal Reserve (Fed) would maintain its policy at restrictive levels if the economy didn’t cool down.

According to the CME FedWatch tool, markets are now pricing in that the Federal Reserve will cut rates in June 2024 sooner than the previous expectations, while the odds of a hike in November remain near 40%. For the rest of the week, investors will eye Personal Consumption Expenditures (PCE) figures from July on Thursday and Friday’s Nonfarm Payrolls from August.

USD/CAD Levels to watch 

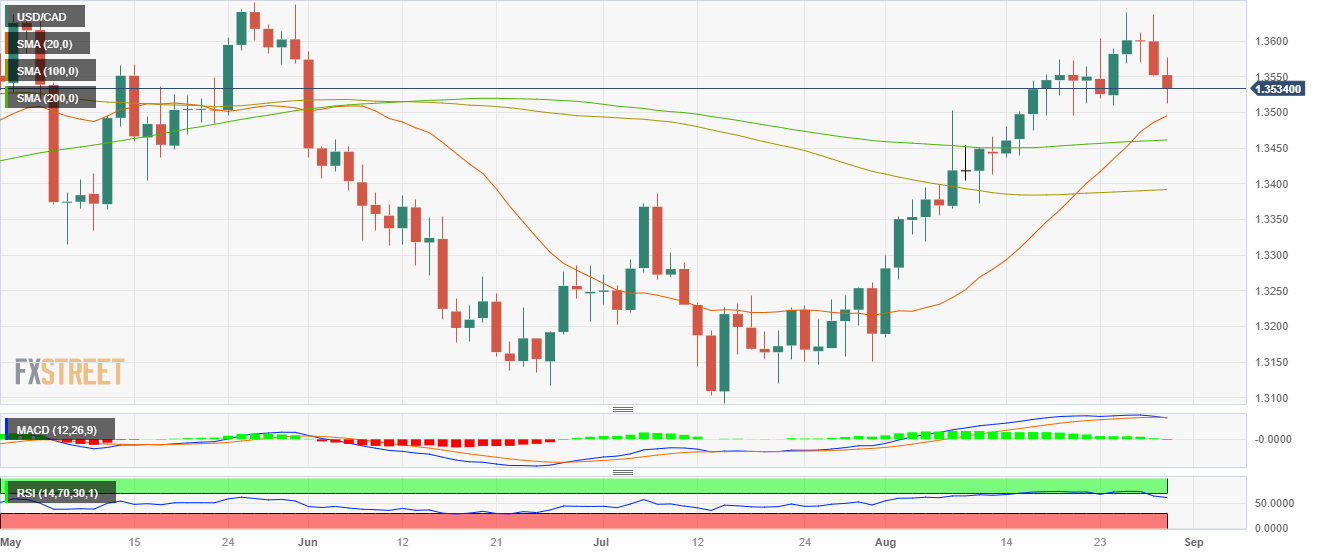
 The daily chart analysis indicates a neutral to a bearish outlook for USD/CAD, as the bears show signs of taking control but still face challenges ahead. The Relative Strength Index (RSI) points downwards in the bullish territory, suggesting a possible trend reversal, while the Moving Average Convergence (MACD) shows weaker green bars. However, the pair is above the 20,100,200-day Simple Moving Average (SMA), pointing towards the prevailing strength of the bulls in the larger context.


 Support levels: 1.3495 (20-day SMA), 1.3460 (200-day SMA), 1.3450.

 Resistance levels: 1.3575, 1.3590, 1.3600.

USD/CAD Daily Chart
USD/CAD

Overview
Today last price1.3532
Today Daily Change-0.0020
Today Daily Change %-0.15
Today daily open1.3552
 
Trends
Daily SMA201.3486
Daily SMA501.3323
Daily SMA1001.3391
Daily SMA2001.3461
 
Levels
Previous Daily High1.3637
Previous Daily Low1.355
Previous Weekly High1.364
Previous Weekly Low1.3496
Previous Monthly High1.3387
Previous Monthly Low1.3093
Daily Fibonacci 38.2%1.3583
Daily Fibonacci 61.8%1.3604
Daily Pivot Point S11.3522
Daily Pivot Point S21.3493
Daily Pivot Point S31.3435
Daily Pivot Point R11.361
Daily Pivot Point R21.3667
Daily Pivot Point R31.3697

Author

Patricio Martín

Patricio is an economist from Argentina passionate about global finance and understanding the daily movements of the markets.


More from Patricio Martín
Share:

Editor's Picks

AUD/USD consolidates above 0.7000; remains close to monthly top

AUD/USD holds steady above 0.7000 during the Asian session on Friday, trading just below the previous day's monthly low amid diverging forces. A hawkish RBA continues to support the Aussie, while the recent decline in US bond yields keeps the US Dollar depressed near a three-week low. However, oil-driven inflation fears reinforce Fed hike bets, which, along with geopolitical risks, could benefit the safe-haven buck and cap the currency pair.

USD/JPY bounces off one-month low; climbs to 157.00 amid reviving USD demand

USD/JPY rebounds from the 156.00 neighborhood, or a one-month low touched during Friday’s Asian session, with bulls looking to extend momentum beyond 157.00 amid the emergence of some US Dollar buying. Meanwhile, Japan's National CPI rose to a nine-month peak and reaffirmed BoJ rate-hike bets, which could support the Japanese Yen and cap gains for the currency pair.

Gold treads water around $4,000

Gold prices maintain its offered stance in place at the end of the week, hovering around the key $4,000 threshold per troy ounce. The persistent selling bias in the precious metal comes amid decent gains in the US Dollar and an acceptable rebound in US Treasury yields across the curve, all alongside further upside traction in crude oil prices.

Crypto Today: Bitcoin holds the 50-day EMA as Ethereum and XRP face structural resistance

Bitcoin gradually ticks up on Friday, trading above $81,000. The Crypto King has recently defended structural support near $80,000, reinforcing the prevailing bullish outlook. Ethereum similarly edges higher above $2,400, while Ripple trades above $1.32 after testing support around $1.30.

The French bond panic is overdone. Here's what the market is misreading 

France's 10-year government bond yield has climbed above 5%, reigniting fears of a sovereign debt crisis in the Eurozone. With public debt exceeding €3.5 trillion, persistent budget deficits and a fragmented political landscape, investors are increasingly questioning the French government's ability to stabilize its finances.

What November 3 means for the Fed's rate path and the US Dollar

The USD faces a decisive period ahead of the November 3 midterm elections. While markets anticipate another interest rate increase from the Fed in December, the battle for control of Congress could reshape fiscal policy expectations and, indirectly, the path of US monetary policy in 2027.