|

USD/CAD rallies near the 1.2900 figure, on falling oil prices and a strong USD

  • USD/CAD climbs sharply due to lower WTI prices spurred by China’s data showing its slowing economy.
  • The New York Fed Empire State Manufacturing Index for August tumbles to -31.3, led by business conditions deteriorating.
  • The USD/CAD might get some cues from Canadian inflation figures, alongside US Federal Reserve minutes to be released on Wednesday.

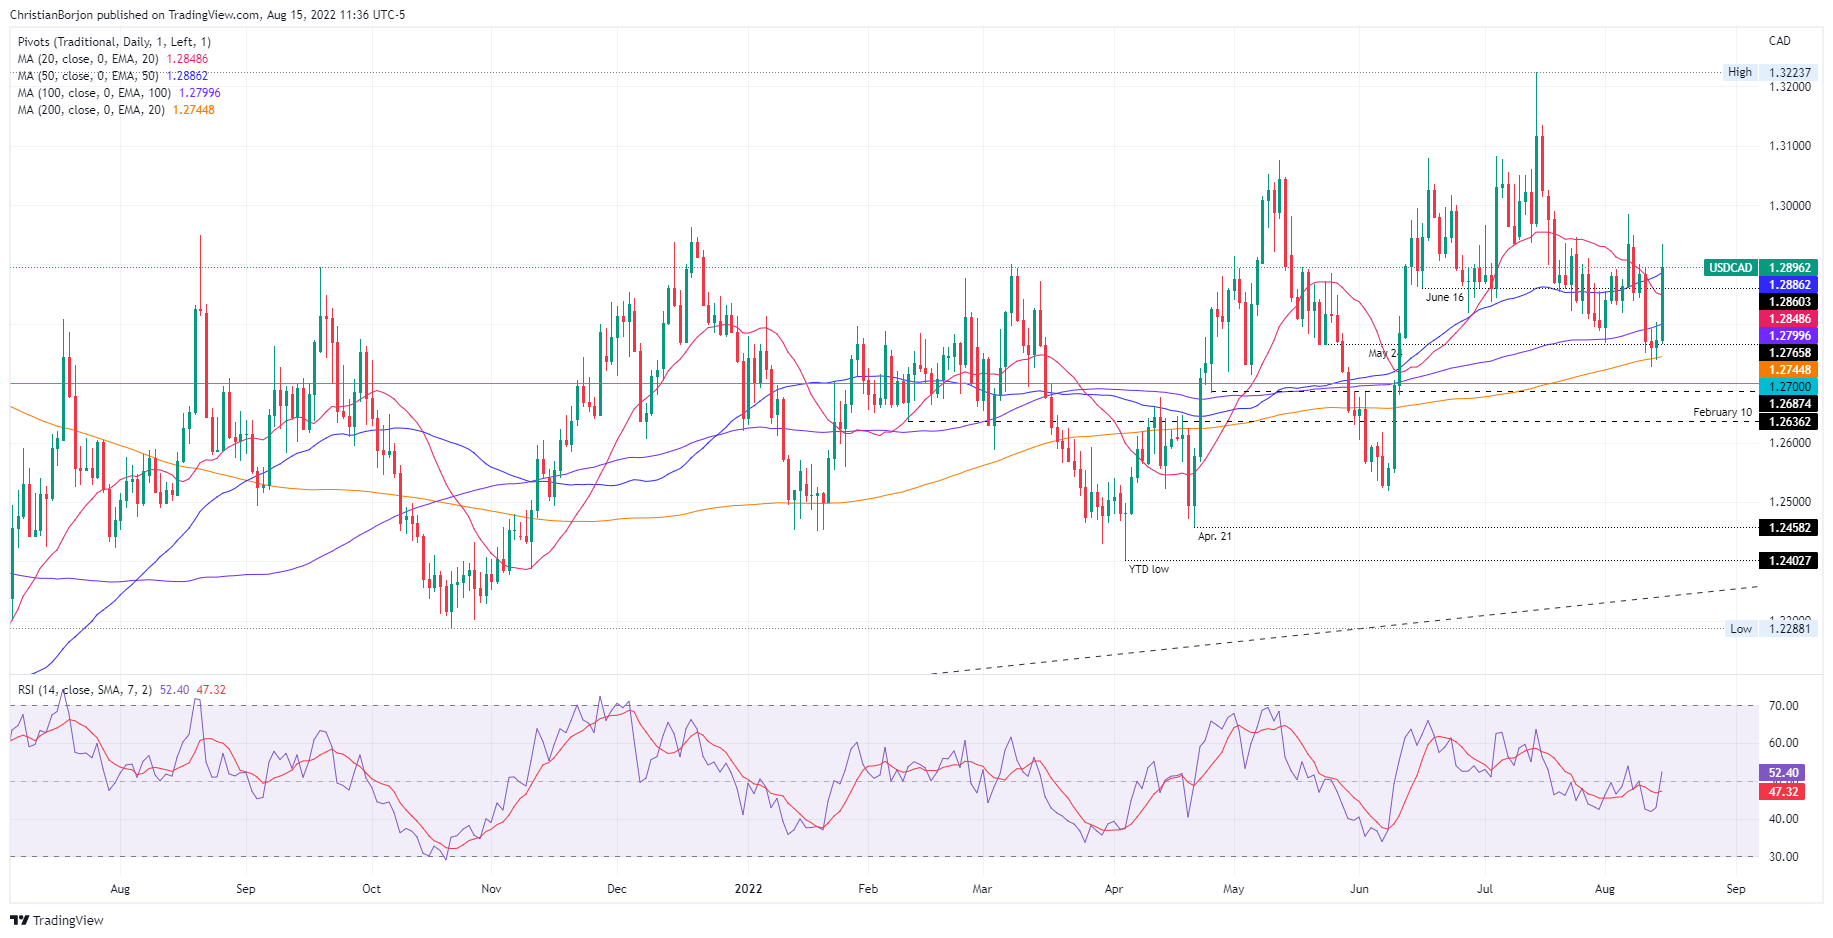
The USD/CAD rebounds from around the 200-day EMA and rallies sharply towards its daily high at 1.2934 due to a risk-off impulse spurred by weak Chinese economic data, alongside lower oil prices. WTI price slid 3.50%, below the $90 per barrel, a tailwind for the USD/CAD.

The USD/CAD is exchanging hands at 1.2896, after opening near its daily lows, reached during the Asian session, at 1.2766, but risk-aversion and broad US dollar strength bolstered the major, extending its gains throughout the day.

Early in the US session, the New York Fed reported its business conditions for August, also known as the NY Fed Empire State index, tumbled to -31.3, worse than estimations as orders and shipments decelerated.

In the meantime, WTI dropped on news of China’s economic slowdown, which reignited recession fears across the globe. Confirmation of the aforementioned is the People’s Bank of China (PBoC) cut its 1-year Medium-Term Lending Facility (MLF) by ten bps to 2.75%. The PBoC reacted to weaker than estimated data, like Industrial Production and Retail Sales, missing forecasts.

What to watch

In the week, the Canadian economic docket will feature inflation data. While the US calendar will reveal Federal Reserve minutes, US Housing data, Initial Jobless Claims,  the Conference Board Leading index, and Fed speak.

USD/CAD Daily chart

USD/CAD Key Technical Levels

USD/CAD

Overview
Today last price1.2896
Today Daily Change0.0113
Today Daily Change %0.88
Today daily open1.2782
 
Trends
Daily SMA201.2855
Daily SMA501.2883
Daily SMA1001.2799
Daily SMA2001.2746
 
Levels
Previous Daily High1.2803
Previous Daily Low1.274
Previous Weekly High1.295
Previous Weekly Low1.2728
Previous Monthly High1.3224
Previous Monthly Low1.2789
Daily Fibonacci 38.2%1.2779
Daily Fibonacci 61.8%1.2764
Daily Pivot Point S11.2747
Daily Pivot Point S21.2711
Daily Pivot Point S31.2683
Daily Pivot Point R11.281
Daily Pivot Point R21.2838
Daily Pivot Point R31.2874

Author

Christian Borjon Valencia

Christian Borjon began his career as a retail trader in 2010, mainly focused on technical analysis and strategies around it. He started as a swing trader, as he used to work in another industry unrelated to the financial markets.

More from Christian Borjon Valencia
Share:

Editor's Picks

EUR/USD steadies near 1.1650 ahead of US Nonfarm Payrolls

EUR/USD holds ground after five days of losses, trading around 1.1650 during the Asian hours on Friday. Traders remain cautious ahead of the US Nonfarm Payrolls report, which is expected to offer further insight into labor market conditions and the Federal Reserve’s policy outlook. December NFP is forecast to show job gains of 60,000, down from 64,000 in November.

GBP/USD: Further weakness could challenge 1.3400

GBP/USD remains under unabated selling pressure on Thursday, slipping to fresh three-day lows around 1.3415 in response to further improvement in the sentiment surrounding the Greenback ahead of Friday’s key NFP data.

Gold edges lower as bulls opt to wait for the crucial US NFP report

Gold struggles to capitalize on the previous day's goodish move up from the vicinity of the $4,400 mark and attracts some sellers during the Asian session on Friday as bulls seem reluctant ahead of the US NFP report. The critical US employment details will offer more cues about the Fed's rate-cut path, which, in turn, will influence the US Dollar price dynamics and provide a fresh impetus to the non-yielding bullion. In the meantime, dovish Fed expectations and rising geopolitical tensions might continue to act as a tailwind for the XAU/USD.

XRP slides as institutional and retail demand falters

Ripple (XRP) is trading down for the third consecutive day on Thursday amid escalating volatility in the cyrptocurrency market. After peaking at $2.41 on Tuesday, its highest print since November 14 amid the early-year rally, XRP has quickly ran into aggressive profit-taking.

2026 economic outlook: Clear skies but don’t unfasten your seatbelts yet

Most years fade into the background as soon as a new one starts. Not 2025: a year of epochal shifts, in which the macroeconomy was the dog that did not bark. What to expect in 2026? The shocks of 2025 will not be undone, but neither will they be repeated.

XRP slides as institutional and retail demand falters

Ripple is trading down for the third consecutive day on Thursday amid escalating volatility in the cyrptocurrency market. After peaking at $2.41 on Tuesday, its highest print since November 14 amid the early-year rally, XRP has quickly ran into aggressive profit-taking.