USD/CAD Price Forecast: Strives to hold 50-day EMA
- USD/CAD turns fragile near 1.4000 as the Canadian Dollar trades broadly firm.
- Investors await the US NFP data for fresh cues on the Fed’s monetary policy outlook.
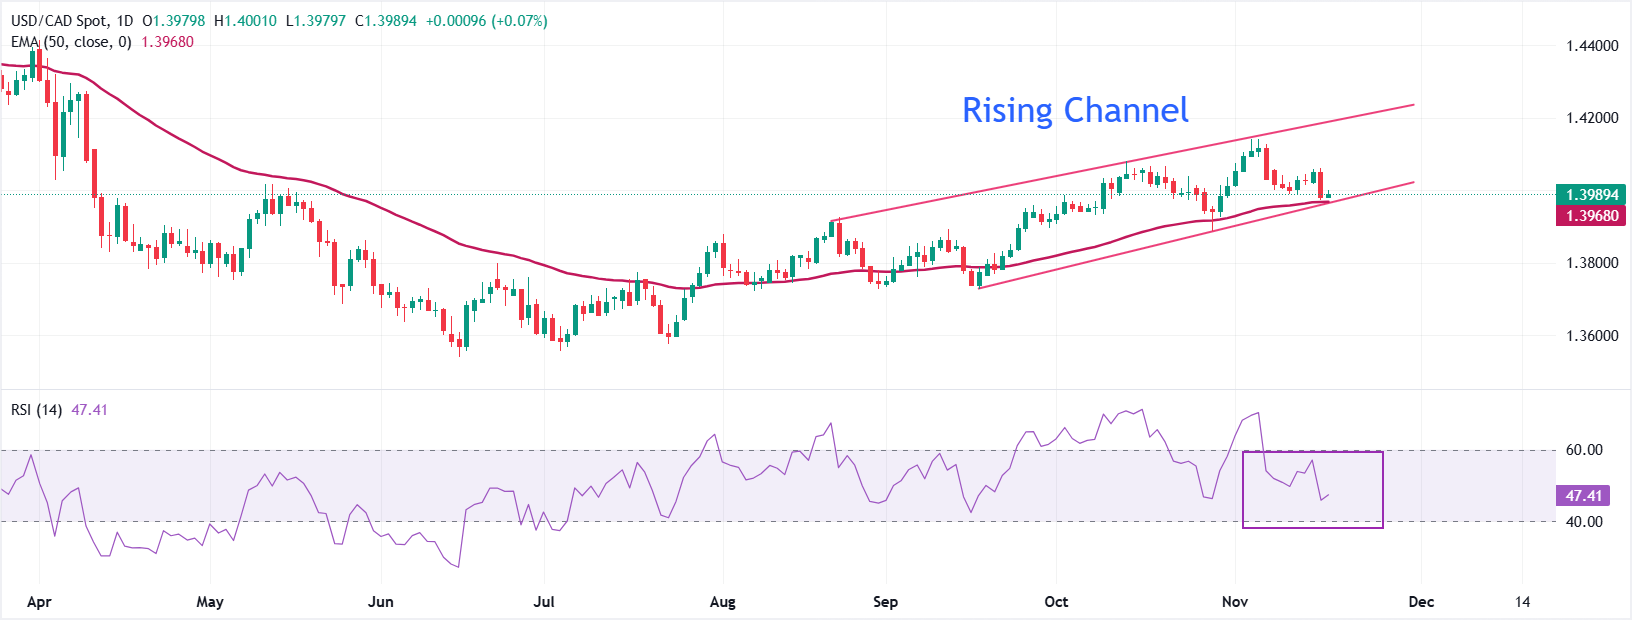
- The Loonie pair corrects to near the lower boundary of the Rising Channel chart pattern.

The USD/CAD pair trades in a tight range near its almost three-week low, slightly below 1.4000, during the early European trading session on Wednesday. The Loonie pair trades cautiously as the Canadian Dollar (CAD) has been outperforming the US Dollar (USD) for the past few weeks on expectations that the Bank of Canada (BoC) will not reduce its borrowing rates further in the near term.
Canadian Dollar Price Last 7 Days
The table below shows the percentage change of Canadian Dollar (CAD) against listed major currencies last 7 days. Canadian Dollar was the strongest against the Japanese Yen.
| USD | EUR | GBP | JPY | CAD | AUD | NZD | CHF | |
|---|---|---|---|---|---|---|---|---|
| USD | -0.05% | 0.09% | 0.79% | -0.10% | 0.59% | 0.33% | -0.11% | |
| EUR | 0.05% | 0.15% | 0.86% | -0.05% | 0.65% | 0.38% | -0.05% | |
| GBP | -0.09% | -0.15% | 0.69% | -0.19% | 0.50% | 0.25% | -0.20% | |
| JPY | -0.79% | -0.86% | -0.69% | -0.89% | -0.20% | -0.48% | -0.90% | |
| CAD | 0.10% | 0.05% | 0.19% | 0.89% | 0.70% | 0.42% | -0.00% | |
| AUD | -0.59% | -0.65% | -0.50% | 0.20% | -0.70% | -0.26% | -0.69% | |
| NZD | -0.33% | -0.38% | -0.25% | 0.48% | -0.42% | 0.26% | -0.43% | |
| CHF | 0.11% | 0.05% | 0.20% | 0.90% | 0.00% | 0.69% | 0.43% |
The heat map shows percentage changes of major currencies against each other. The base currency is picked from the left column, while the quote currency is picked from the top row. For example, if you pick the Canadian Dollar from the left column and move along the horizontal line to the US Dollar, the percentage change displayed in the box will represent CAD (base)/USD (quote).
In the October policy meeting, the BoC stated after reducing interest rates by 25 basis points (bps) to 2.25% that the current monetary policy is optimal to keep inflation near the 2% target.
Meanwhile, the US Dollar (USD) struggles to extend the latest recovery move initiated on Friday. The US Dollar is expected to stay on the sidelines as investors await the United States (US) Nonfarm Payrolls (NFP) data for October, which will be released on Thursday.
The impact of the US NFP data will be significant on the US Dollar and the Federal Reserve’s (Fed) monetary policy outlook, as it will be the first economic release since the federal reopening after a 43-day shutdown.
USD/CAD corrects to near the 50-day Exponential Moving Average (EMA), which trades around 1.3968. The overall trend of the pair remains bullish as it trades inside the Rising Channel formation.
The 14-day Relative Strength Index (RSI) falls slightly below 50.00, suggesting an ongoing correction.
Given that the Loonie pair is close to the lower border of the Rising Channel formation, the odds of a recovery move are high. An upside move by the pair above the November 18 high of 1.4062 would open the door towards the April 8 low of 1.4144, followed by the April 9 high of 1.4274.
On the flip side, the asset could slide towards the round level of 1.3600 and the June 16 low of 1.3540 if it extends retracement below the August 7 low of 1.3722.
USD/CAD daily chart
Canadian Dollar FAQs
The key factors driving the Canadian Dollar (CAD) are the level of interest rates set by the Bank of Canada (BoC), the price of Oil, Canada’s largest export, the health of its economy, inflation and the Trade Balance, which is the difference between the value of Canada’s exports versus its imports. Other factors include market sentiment – whether investors are taking on more risky assets (risk-on) or seeking safe-havens (risk-off) – with risk-on being CAD-positive. As its largest trading partner, the health of the US economy is also a key factor influencing the Canadian Dollar.
The Bank of Canada (BoC) has a significant influence on the Canadian Dollar by setting the level of interest rates that banks can lend to one another. This influences the level of interest rates for everyone. The main goal of the BoC is to maintain inflation at 1-3% by adjusting interest rates up or down. Relatively higher interest rates tend to be positive for the CAD. The Bank of Canada can also use quantitative easing and tightening to influence credit conditions, with the former CAD-negative and the latter CAD-positive.
The price of Oil is a key factor impacting the value of the Canadian Dollar. Petroleum is Canada’s biggest export, so Oil price tends to have an immediate impact on the CAD value. Generally, if Oil price rises CAD also goes up, as aggregate demand for the currency increases. The opposite is the case if the price of Oil falls. Higher Oil prices also tend to result in a greater likelihood of a positive Trade Balance, which is also supportive of the CAD.
While inflation had always traditionally been thought of as a negative factor for a currency since it lowers the value of money, the opposite has actually been the case in modern times with the relaxation of cross-border capital controls. Higher inflation tends to lead central banks to put up interest rates which attracts more capital inflows from global investors seeking a lucrative place to keep their money. This increases demand for the local currency, which in Canada’s case is the Canadian Dollar.
Macroeconomic data releases gauge the health of the economy and can have an impact on the Canadian Dollar. Indicators such as GDP, Manufacturing and Services PMIs, employment, and consumer sentiment surveys can all influence the direction of the CAD. A strong economy is good for the Canadian Dollar. Not only does it attract more foreign investment but it may encourage the Bank of Canada to put up interest rates, leading to a stronger currency. If economic data is weak, however, the CAD is likely to fall.
Author

Sagar Dua
FXStreet
Sagar Dua is associated with the financial markets from his college days. Along with pursuing post-graduation in Commerce in 2014, he started his markets training with chart analysis.














