USD/CAD Price Forecast: Falls to near 1.3650, eight-month lows
- USD/CAD may test primary support at the eight-month low of 1.3634.
- The 14-day RSI remains above 30, reinforcing bearish bias.
- The primary resistance appears at the nine-day EMA of 1.3695.

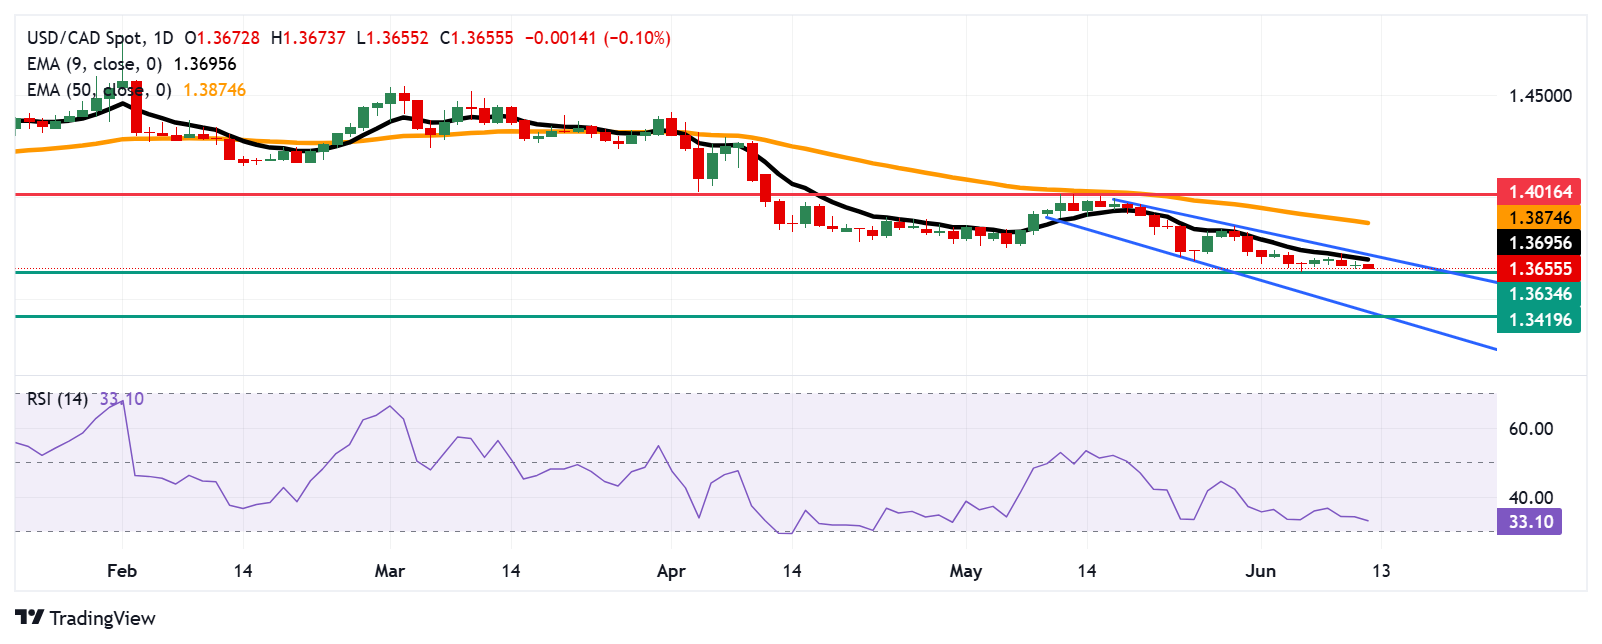
The USD/CAD pair is retracing its recent gains registered in the previous session, trading around 1.3660 during the Asian hours on Thursday. A persistent bearish sentiment prevails as the pair moves downwards within the descending channel pattern, suggested by the technical analysis of the daily chart.
The 14-day Relative Strength Index (RSI) consolidates slightly above the 30 level, reinforcing bearish pressure. A break below the 30 mark would indicate an oversold situation and a potential upward correction soon. Additionally, the USD/CAD pair is also remaining below the nine-day Exponential Moving Average (EMA), pointing to weaker short-term momentum.
The USD/CAD pair may find initial support near the eight-month low at 1.3634, which was recorded on June 5. A break below this level could weaken the price momentum and put downward pressure on the pair to navigate the region around the lower boundary of the descending channel around 1.3450, followed by 1.3419, the lowest since February 2024.
On the upside, the USD/CAD pair may encounter primary resistance at the nine-day EMA of 1.3695, followed by the descending channel’s upper boundary around 1.3720. A break above this crucial resistance zone could weaken the bearish bias and lead the pair to approach the 50-day EMA at 1.3874, followed by the two-month high of 1.4016, which was reached on May 13.
USD/CAD: Daily Chart
Canadian Dollar PRICE Today
The table below shows the percentage change of Canadian Dollar (CAD) against listed major currencies today. Canadian Dollar was the strongest against the Australian Dollar.
| USD | EUR | GBP | JPY | CAD | AUD | NZD | CHF | |
|---|---|---|---|---|---|---|---|---|
| USD | -0.23% | -0.26% | -0.42% | -0.11% | 0.09% | -0.08% | -0.43% | |
| EUR | 0.23% | -0.03% | -0.20% | 0.11% | 0.30% | 0.13% | -0.18% | |
| GBP | 0.26% | 0.03% | -0.16% | 0.14% | 0.32% | 0.16% | -0.18% | |
| JPY | 0.42% | 0.20% | 0.16% | 0.29% | 0.49% | 0.29% | -0.01% | |
| CAD | 0.11% | -0.11% | -0.14% | -0.29% | 0.20% | 0.01% | -0.32% | |
| AUD | -0.09% | -0.30% | -0.32% | -0.49% | -0.20% | -0.15% | -0.49% | |
| NZD | 0.08% | -0.13% | -0.16% | -0.29% | -0.01% | 0.15% | -0.34% | |
| CHF | 0.43% | 0.18% | 0.18% | 0.01% | 0.32% | 0.49% | 0.34% |
The heat map shows percentage changes of major currencies against each other. The base currency is picked from the left column, while the quote currency is picked from the top row. For example, if you pick the Canadian Dollar from the left column and move along the horizontal line to the US Dollar, the percentage change displayed in the box will represent CAD (base)/USD (quote).
Author

Akhtar Faruqui
FXStreet
Akhtar Faruqui is a Forex Analyst based in New Delhi, India. With a keen eye for market trends and a passion for dissecting complex financial dynamics, he is dedicated to delivering accurate and insightful Forex news and analysis.


