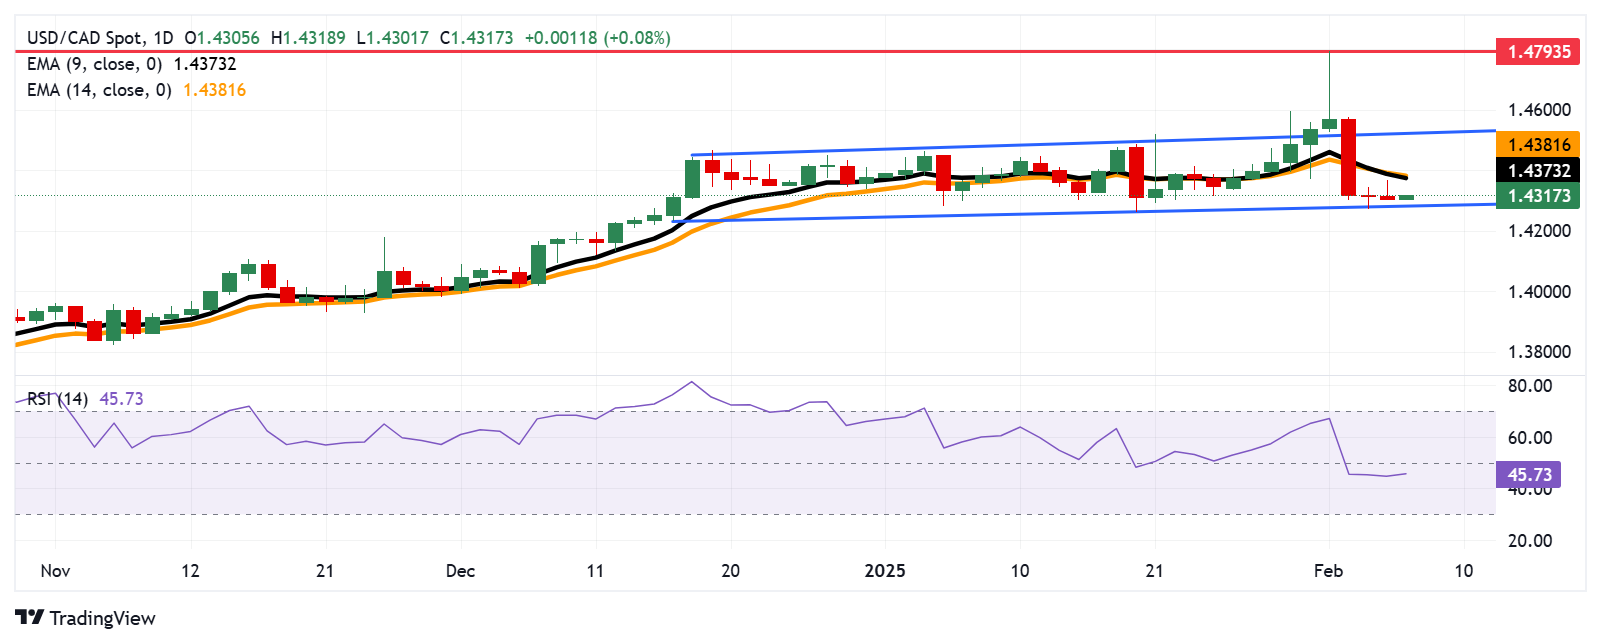
USD/CAD Price Forecast: Consolidates above 1.4300, lower threshold of rectangle
- USD/CAD may test the lower boundary of the rectangle at 1.4280 level.
- The short-term price momentum is weaker as the pair remains below the nine- and 14-day EMAs.
- A break above EMAs would support the pair to test the rectangle’s upper threshold at 1.4530 level.

The USD/CAD pair remains silent around 1.4310 during the Asian session on Friday. The technical analysis of the daily chart indicates that buyers and sellers are unsure of the long-term direction of the asset as the pair consolidates within a rectangular pattern.
USD/CAD remains below the nine- and 14-day Exponential Moving Averages (EMAs), reinforcing bearish sentiment and suggesting weak short-term price action. This positioning reflects sustained selling interest and hints at further downside risks.
Additionally, the 14-day Relative Strength Index (RSI) consolidates below the 50 mark, signaling continued negative momentum and strengthening the bearish outlook.
On the downside, immediate support is found at a psychological level of 1.4300, followed by the lower threshold of the rectangle at 1.4280 level. A break below this critical support zone could strengthen the bearish bias and put downward pressure on the USD/CAD pair to navigate the region around the psychological level of 1.4200.
The USD/CAD pair could find its initial resistance at the nine-day EMA at 1.4372 level, followed by the 14-day EMA at 1.4381 level. A break above these levels would improve the short-term price momentum and support the pair to test the rectangle’s upper threshold at the 1.4530 level.
USD/CAD: Daily Chart
Canadian Dollar PRICE Today
The table below shows the percentage change of Canadian Dollar (CAD) against listed major currencies today. Canadian Dollar was the strongest against the Swiss Franc.
| USD | EUR | GBP | JPY | CAD | AUD | NZD | CHF | |
|---|---|---|---|---|---|---|---|---|
| USD | 0.09% | 0.10% | 0.00% | 0.08% | -0.04% | -0.10% | 0.16% | |
| EUR | -0.09% | 0.00% | -0.09% | 0.00% | -0.12% | -0.18% | 0.08% | |
| GBP | -0.10% | -0.01% | -0.11% | -0.02% | -0.13% | -0.19% | 0.08% | |
| JPY | 0.00% | 0.09% | 0.11% | 0.07% | -0.05% | -0.14% | 0.14% | |
| CAD | -0.08% | -0.00% | 0.02% | -0.07% | -0.13% | -0.18% | 0.08% | |
| AUD | 0.04% | 0.12% | 0.13% | 0.05% | 0.13% | -0.06% | 0.21% | |
| NZD | 0.10% | 0.18% | 0.19% | 0.14% | 0.18% | 0.06% | 0.26% | |
| CHF | -0.16% | -0.08% | -0.08% | -0.14% | -0.08% | -0.21% | -0.26% |
The heat map shows percentage changes of major currencies against each other. The base currency is picked from the left column, while the quote currency is picked from the top row. For example, if you pick the Canadian Dollar from the left column and move along the horizontal line to the US Dollar, the percentage change displayed in the box will represent CAD (base)/USD (quote).
Author

Akhtar Faruqui
FXStreet
Akhtar Faruqui is a Forex Analyst based in New Delhi, India. With a keen eye for market trends and a passion for dissecting complex financial dynamics, he is dedicated to delivering accurate and insightful Forex news and analysis.


