USD/CAD Price Forecast: Breaks below 1.3950 as bearish bias prevails
- USD/CAD could extend its decline, with the daily chart pointing to a sustained bearish trend.
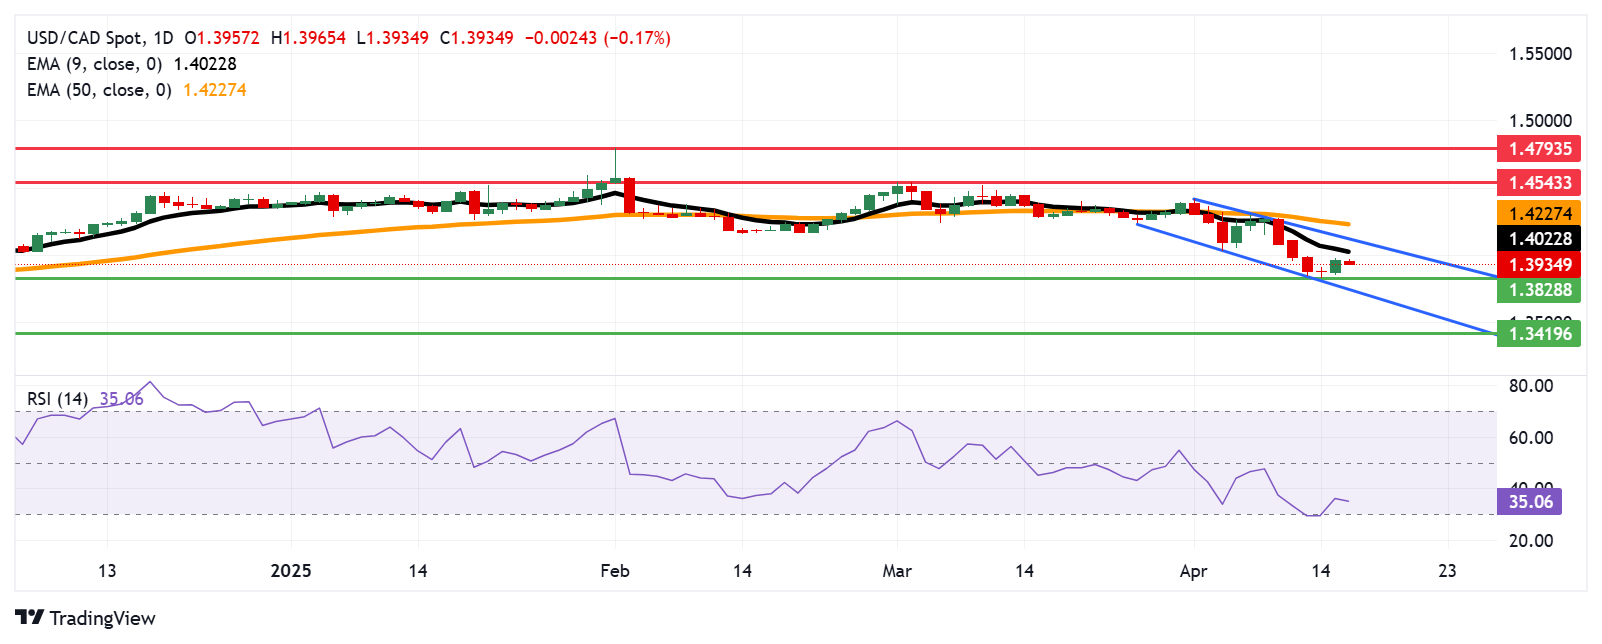
- The 14-day RSI remains below the 50 mark, reinforcing the persistent bearish bias.
- The nine-day EMA near 1.4023 could serve as the immediate resistance level.

The USD/CAD pair slips slightly after posting gains in the previous session, trading near 1.3940 during Wednesday’s Asian session. Technical analysis on the daily chart indicates a prevailing bearish trend as the pair continues to move lower within a descending channel.
Additionally, the USD/CAD pair continues to trade below the nine-day Exponential Moving Average (EMA), indicating subdued short-term momentum. At the same time, the 14-day Relative Strength Index (RSI) has climbed above the 30 level, hinting at a potential short-term corrective rebound. However, with the 14-day RSI still below the 50 threshold, the overall bearish bias remains intact.
On the downside, the USD/CAD pair could revisit the six-month low of 1.3828, recorded on Monday, aligning closely with the lower boundary of the descending channel around the 1.3750 region. A clear break below this support zone would likely strengthen the bearish outlook and open the door for a decline toward the 1.3419 area — the lowest level since February 2024.
Initial resistance for the USD/CAD pair is located at the nine-day EMA around 1.4023, followed by the upper boundary of the descending channel near 1.4130. A breakout above this channel could signal a shift to a bullish bias, potentially pushing the pair toward the 50-day EMA at 1.4227. Beyond that, the next key resistance lies at the two-month high of 1.4543, reached on March 4.
USD/CAD: Daily Chart
Canadian Dollar PRICE Today
The table below shows the percentage change of Canadian Dollar (CAD) against listed major currencies today. Canadian Dollar was the weakest against the Swiss Franc.
| USD | EUR | GBP | JPY | CAD | AUD | NZD | CHF | |
|---|---|---|---|---|---|---|---|---|
| USD | -0.59% | -0.27% | -0.43% | -0.17% | -0.38% | -0.38% | -0.97% | |
| EUR | 0.59% | 0.34% | 0.15% | 0.40% | 0.44% | 0.22% | -0.39% | |
| GBP | 0.27% | -0.34% | -0.19% | 0.07% | 0.11% | -0.12% | -0.67% | |
| JPY | 0.43% | -0.15% | 0.19% | 0.28% | 0.37% | 0.11% | -0.57% | |
| CAD | 0.17% | -0.40% | -0.07% | -0.28% | 0.07% | -0.18% | -0.72% | |
| AUD | 0.38% | -0.44% | -0.11% | -0.37% | -0.07% | -0.25% | -0.78% | |
| NZD | 0.38% | -0.22% | 0.12% | -0.11% | 0.18% | 0.25% | -0.56% | |
| CHF | 0.97% | 0.39% | 0.67% | 0.57% | 0.72% | 0.78% | 0.56% |
The heat map shows percentage changes of major currencies against each other. The base currency is picked from the left column, while the quote currency is picked from the top row. For example, if you pick the Canadian Dollar from the left column and move along the horizontal line to the US Dollar, the percentage change displayed in the box will represent CAD (base)/USD (quote).
Author

Akhtar Faruqui
FXStreet
Akhtar Faruqui is a Forex Analyst based in New Delhi, India. With a keen eye for market trends and a passion for dissecting complex financial dynamics, he is dedicated to delivering accurate and insightful Forex news and analysis.


