USD/CAD Price Forecast: 50% Fibo retracement near 1.3755 acts as key barrier
- USD/CAD ticks lower to near 1.3735 as the US Dollar comes under pressure.
- Iran is focused on ending the war at this stage.
- Investors await Canadian CPI data for April and FOMC minutes.

The USD/CAD pair trades marginally lower to near 1.3735 during the European trading session on Monday. The Loonie pair faces selling pressure as the US Dollar (USD) turns upside down due to hopes that the United States (US) and Iran will break the deadlock and reach a deal soon.
US Dollar Price Today
The table below shows the percentage change of US Dollar (USD) against listed major currencies today. US Dollar was the weakest against the British Pound.
| USD | EUR | GBP | JPY | CAD | AUD | NZD | CHF | |
|---|---|---|---|---|---|---|---|---|
| USD | -0.12% | -0.34% | 0.05% | -0.06% | -0.11% | -0.34% | -0.22% | |
| EUR | 0.12% | -0.23% | 0.18% | 0.05% | -0.01% | -0.22% | -0.10% | |
| GBP | 0.34% | 0.23% | 0.40% | 0.28% | 0.23% | 0.00% | 0.13% | |
| JPY | -0.05% | -0.18% | -0.40% | -0.15% | -0.18% | -0.44% | -0.29% | |
| CAD | 0.06% | -0.05% | -0.28% | 0.15% | -0.04% | -0.27% | -0.15% | |
| AUD | 0.11% | 0.00% | -0.23% | 0.18% | 0.04% | -0.21% | -0.07% | |
| NZD | 0.34% | 0.22% | -0.01% | 0.44% | 0.27% | 0.21% | 0.13% | |
| CHF | 0.22% | 0.10% | -0.13% | 0.29% | 0.15% | 0.07% | -0.13% |
The heat map shows percentage changes of major currencies against each other. The base currency is picked from the left column, while the quote currency is picked from the top row. For example, if you pick the US Dollar from the left column and move along the horizontal line to the Japanese Yen, the percentage change displayed in the box will represent USD (base)/JPY (quote).
As of writing, the US Dollar Index (DXY), which tracks the Greenback’s value against six major currencies, trades 0.14% lower to near 99.13.
A spokesperson from Iran’s Foreign Ministry said during the day negotiations with the US through Pakistan are still ongoing, and Tehran is “focused on ending the war at this stage”.
In the European session, US President Donald Trump also said in an interview with Fortune that Iran is dying for a deal.
Meanwhile, the Canadian markets will be closed on Monday due to Victoria Day. Going forward, investors will focus on the Canadian Consumer Price Index (CPI) data for April and the Federal Open Market Committee (FOMC) minutes of the April policy meeting, which will be released on Tuesday and Wednesday, respectively.
USD/CAD technical analysis
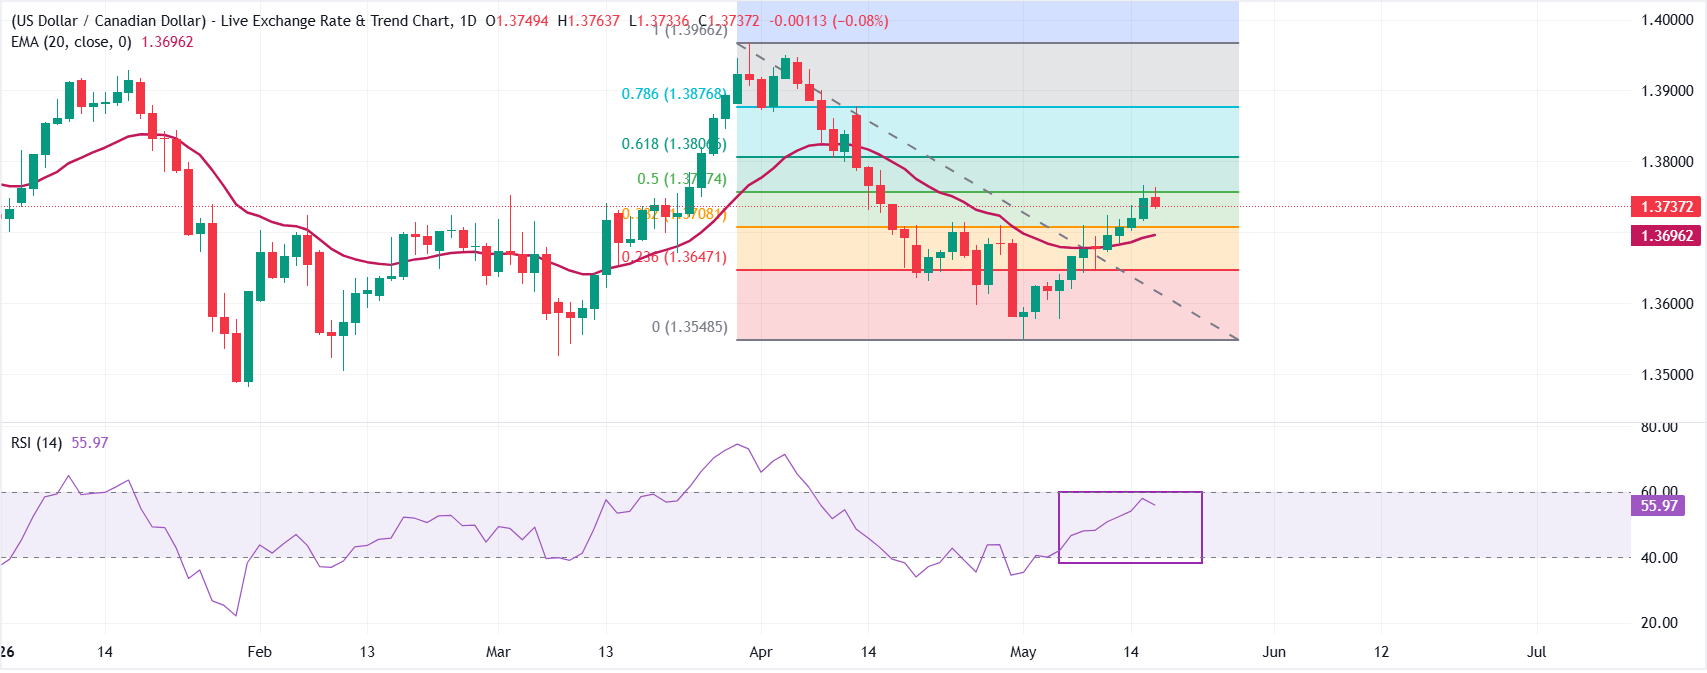
USD/CAD drops to 1.3735 after failing to extend its advance above the 50% Fibonacci retracement of the 1.3550-1.3967 leg at 1.3756. The pair trades above the 20-day Exponential Moving Average (EMA) at 1.3696, suggesting that the near-term bullish bias is still intact.
The Relative Strength Index (14) at around 56 leans modestly bullish, yet momentum strength has not been sufficient to force a clear break through the nearby retracement ceiling.
On the topside, initial resistance is located at the 50% Fibonacci retracement at 1.3757, followed by the 61.8% level at 1.3807; a sustained move above this latter barrier would ease the current cap and open the way toward 1.3877 and the cycle high area near 1.3966.
On the downside, first support emerges at the 38.2% retracement at 1.3708, with the 20-day EMA at 1.3696 reinforcing this area; a break lower would expose the 23.6% retracement at 1.3647, ahead of more substantial structure around 1.3549.
(The technical analysis of this story was written with the help of an AI tool.)
Author

Sagar Dua
FXStreet
Sagar Dua is associated with the financial markets from his college days. Along with pursuing post-graduation in Commerce in 2014, he started his markets training with chart analysis.