British Pound gains as Japanese Yen struggles despite hawkish BoJ outlook
- GBP/JPY rebounds on Thursday as the Japanese Yen underperforms its major peers.
- The wide interest-rate gap between the UK and Japan keeps the British Pound in favour.
- Technically, GBP/JPY holds above key daily moving averages, with initial resistance seen at 216.50.

GBP/JPY edges higher on Thursday, reversing all the losses recorded on the previous day. The move is largely driven by broad Japanese Yen (JPY) weakness rather than any major positive development for the British Pound (GBP), with a sparse economic calendar offering little fresh impetus. At the time of writing, the cross trades around 216.33, up 0.53% on the day.
Despite expectations that the Bank of Japan (BoJ) could raise interest rates next month, the Yen stays under pressure. Higher Oil prices linked to the US-Iran standoff are a key near-term headwind, as Japan relies heavily on imported energy from the Middle East. Broader concerns over government spending and high public debt also weigh on the currency.
Meanwhile, UK inflation and labour-market figures released this week suggest that the Bank of England (BoE) will maintain its current policy stance and keep interest rates unchanged at 3.75%, well above the Bank of Japan’s 1% policy rate. From a trader’s perspective, the wide rate gap favours the higher-yielding British Pound and supports further upside in GBP/JPY.
Looking ahead, traders await Japan’s National Consumer Price Index (CPI), UK Retail Sales and the preliminary S&P Global Purchasing Managers’ Index (PMI) reports for August, all due on Friday.
Technical analysis
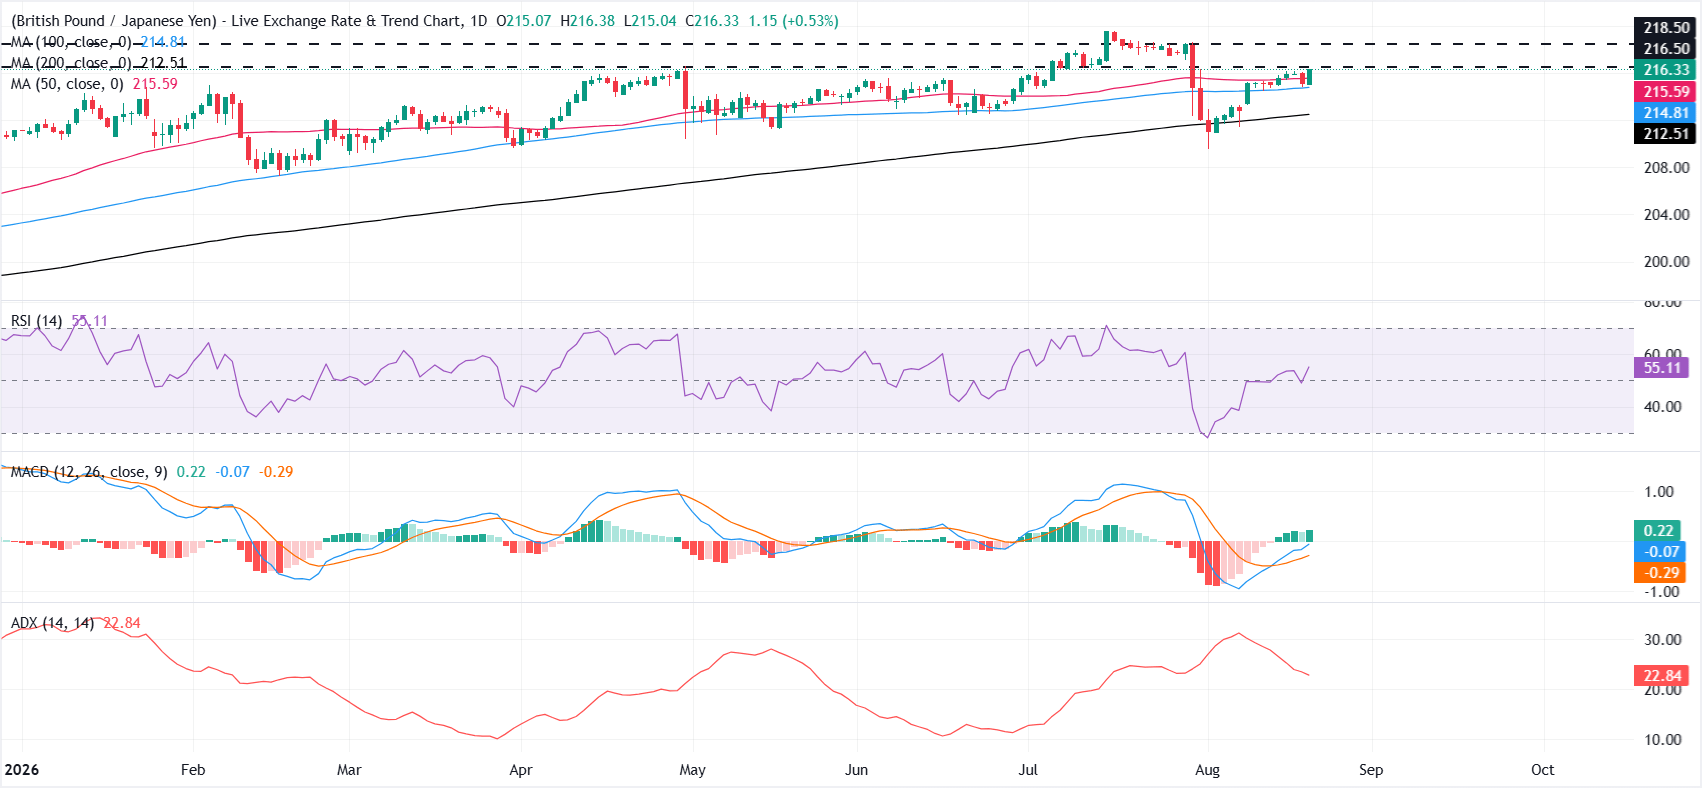
From a technical perspective, GBP/JPY has recovered around half of the losses triggered by the joint US-Japan foreign exchange intervention. The cross bounced from the 200-day Simple Moving Average (SMA) and subsequently climbed above the 100-day and 50-day SMAs, reinforcing the constructive near-term bias.
The 14-day Relative Strength Index (RSI) stands near 55, leaning to the upside without approaching overbought territory. The Moving Average Convergence Divergence (MACD) has also turned positive, suggesting that bullish momentum is rebuilding, while the Average Directional Index (ADX) near 23 points to moderate trend strength.
On the topside, initial resistance is seen at the horizontal barrier around 216.50, followed by a stronger cap at 218.50. On the downside, the 50-day SMA at 215.59 offers initial support, ahead of the 100-day SMA at 214.81. A deeper pullback could expose the 200-day SMA at 212.51.
Japanese Yen Price Today
The table below shows the percentage change of Japanese Yen (JPY) against listed major currencies today. Japanese Yen was the strongest against the Australian Dollar.
| USD | EUR | GBP | JPY | CAD | AUD | NZD | CHF | |
|---|---|---|---|---|---|---|---|---|
| USD | -0.06% | -0.19% | 0.38% | -0.29% | 0.23% | -0.19% | 0.10% | |
| EUR | 0.06% | -0.13% | 0.45% | -0.21% | 0.29% | -0.14% | 0.16% | |
| GBP | 0.19% | 0.13% | 0.56% | -0.09% | 0.42% | 0.00% | 0.28% | |
| JPY | -0.38% | -0.45% | -0.56% | -0.65% | -0.13% | -0.57% | -0.28% | |
| CAD | 0.29% | 0.21% | 0.09% | 0.65% | 0.53% | 0.10% | 0.38% | |
| AUD | -0.23% | -0.29% | -0.42% | 0.13% | -0.53% | -0.42% | -0.16% | |
| NZD | 0.19% | 0.14% | -0.00% | 0.57% | -0.10% | 0.42% | 0.31% | |
| CHF | -0.10% | -0.16% | -0.28% | 0.28% | -0.38% | 0.16% | -0.31% |
The heat map shows percentage changes of major currencies against each other. The base currency is picked from the left column, while the quote currency is picked from the top row. For example, if you pick the Japanese Yen from the left column and move along the horizontal line to the US Dollar, the percentage change displayed in the box will represent JPY (base)/USD (quote).
Author

Vishal Chaturvedi
FXStreet
I am a macro-focused research analyst with over four years of experience covering forex and commodities market. I enjoy breaking down complex economic trends and turning them into clear, actionable insights that help traders stay ahead of the curve.

















