USD/CAD Price Analysis: Upside remains capped below 21-DMA ahead US/Canadian data


  • USD/CAD holds gains above 1.2800 amid stabilizing US dollar.
  • The oil price rebound lends support to the CAD, capping the upside.
  • The pair turns lower below 21-DMA after rejection at higher levels.

USD/CAD is off the daily highs near 1.2850 but remains better bid above 1.2800, as bulls find support from the pause in the US dollar sell-off ahead of the US GDP and Canadian Retail Sales data.

The dollar licks its wound following the not-that-hawkish Fed May meeting’s minutes, as it downplayed expectations of a more than 50 bps rate hike in the third quarter.

Meanwhile, the strength in the US oil prices caps the upside in the major, lending support to the resource-linked Canadian dollar.

Looking ahead, the US Q1 GDP revision, Pending Home Sales and the Canadian Retail Sales data will offer fresh trading impetus to USD/CAD traders.

From a short-term technical perspective, USD/CAD bulls have failed to find acceptance at higher levels after Monday’s slump to 1.2765 levels.

The 14-day Relative Strength Index (RSI) is trading listlessly just above the midline, suggesting that the spot lacks a clear directional bias.

Only a sustained move above the horizontal 21-Daily Moving Average (DMA) level at 1.2870 could help initiate a meaningful recovery towards 1.2900.

The 1.2950 psychological level will be the next relevant upside target.

USD/CAD: Daily chart

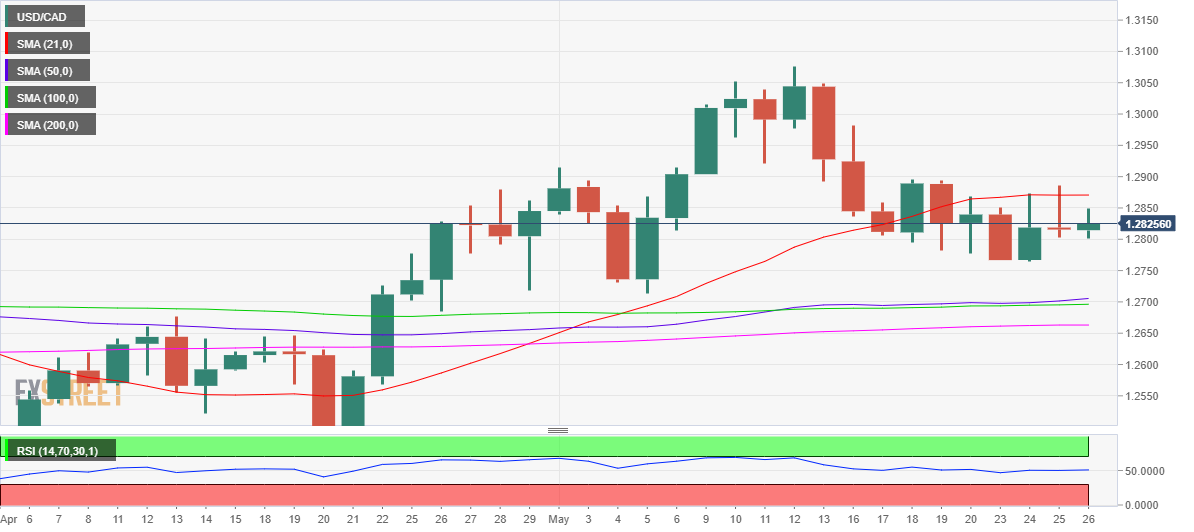
On the downside, bears need to crack the 1.2765 key demand area to resume the downtrend from May highs of 1.3076.

Further down, the confluence of the 50 and 100-DMAs around 1.2700 will act as strong support, below which the mildly bullish 200-DMA at 1.2663 will come into play.

USD/CAD: Additional levels to consider

USD/CAD

Overview
Today last price 1.2825
Today Daily Change 0.0009
Today Daily Change % 0.07
Today daily open 1.2816
 
Trends
Daily SMA20 1.2873
Daily SMA50 1.2701
Daily SMA100 1.2695
Daily SMA200 1.2663
 
Levels
Previous Daily High 1.2885
Previous Daily Low 1.2803
Previous Weekly High 1.2982
Previous Weekly Low 1.2776
Previous Monthly High 1.288
Previous Monthly Low 1.2403
Daily Fibonacci 38.2% 1.2834
Daily Fibonacci 61.8% 1.2854
Daily Pivot Point S1 1.2784
Daily Pivot Point S2 1.2752
Daily Pivot Point S3 1.2701
Daily Pivot Point R1 1.2866
Daily Pivot Point R2 1.2917
Daily Pivot Point R3 1.2949


Share: Feed news

Information on these pages contains forward-looking statements that involve risks and uncertainties. Markets and instruments profiled on this page are for informational purposes only and should not in any way come across as a recommendation to buy or sell in these assets. You should do your own thorough research before making any investment decisions. FXStreet does not in any way guarantee that this information is free from mistakes, errors, or material misstatements. It also does not guarantee that this information is of a timely nature. Investing in Open Markets involves a great deal of risk, including the loss of all or a portion of your investment, as well as emotional distress. All risks, losses and costs associated with investing, including total loss of principal, are your responsibility. The views and opinions expressed in this article are those of the authors and do not necessarily reflect the official policy or position of FXStreet nor its advertisers. The author will not be held responsible for information that is found at the end of links posted on this page.

If not otherwise explicitly mentioned in the body of the article, at the time of writing, the author has no position in any stock mentioned in this article and no business relationship with any company mentioned. The author has not received compensation for writing this article, other than from FXStreet.

FXStreet and the author do not provide personalized recommendations. The author makes no representations as to the accuracy, completeness, or suitability of this information. FXStreet and the author will not be liable for any errors, omissions or any losses, injuries or damages arising from this information and its display or use. Errors and omissions excepted.

The author and FXStreet are not registered investment advisors and nothing in this article is intended to be investment advice.

Recommended content


Recommended content

Editors’ Picks

EUR/USD clings to daily gains above 1.0650

EUR/USD clings to daily gains above 1.0650

EUR/USD gained traction and turned positive on the day above 1.0650. The improvement seen in risk mood following the earlier flight to safety weighs on the US Dollar ahead of the weekend and helps the pair push higher.

EUR/USD News

GBP/USD recovers toward 1.2450 after UK Retail Sales data

GBP/USD recovers toward 1.2450 after UK Retail Sales data

GBP/USD reversed its direction and advanced to the 1.2450 area after touching a fresh multi-month low below 1.2400 in the Asian session. The positive shift seen in risk mood on easing fears over a deepening Iran-Israel conflict supports the pair.

GBP/USD News

Gold holds steady at around $2,380 following earlier spike

Gold holds steady at around $2,380 following earlier spike

Gold stabilized near $2,380 after spiking above $2,400 with the immediate reaction to reports of Israel striking Iran. Meanwhile, the pullback seen in the US Treasury bond yields helps XAU/USD hold its ground.

Gold News

Bitcoin Weekly Forecast: BTC post-halving rally could be partially priced in Premium

Bitcoin Weekly Forecast: BTC post-halving rally could be partially priced in

Bitcoin price shows no signs of directional bias while it holds above  $60,000. The fourth BTC halving is partially priced in, according to Deutsche Bank’s research. 

Read more

Week ahead – US GDP and BoJ decision on top of next week’s agenda

Week ahead – US GDP and BoJ decision on top of next week’s agenda

US GDP, core PCE and PMIs the next tests for the Dollar. Investors await BoJ for guidance about next rate hike. EU and UK PMIs, as well as Australian CPIs also on tap.

Read more

Forex MAJORS

Cryptocurrencies

Signatures