|

USD/CAD Price Analysis: Struggles to find acceptance above 100 DMA, bullish potential intact

  • USD/CAD climbs to its highest level since January and draws support from a combination of factors.
  • Sliding Crude Oil prices undermines the Loonie and provides a goodish lift amid sustained USD buying.
  • The overbought RSI on hourly charts fails to assist bulls to find acceptance above the 100-day SMA.

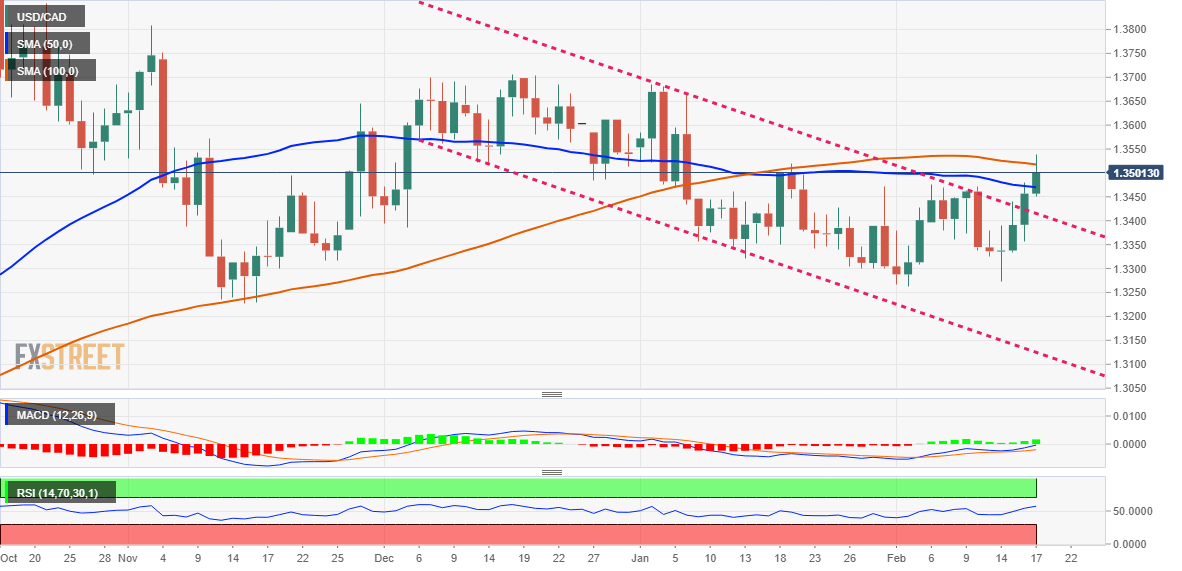
The USD/CAD pair builds on this week's goodish rebound from the vicinity of the monthly low and gains strong follow-through traction on Friday. The momentum lifts spot prices to the 1.3535-1.3540 region, or the highest level since January 6, and is sponsored by a combination of factors.

Crude Oil prices tumble to a one-and-half-week low amid worries that rising borrowing costs will dampen economic growth and dent fuel demand. This, in turn, undermines the commodity-linked Loonie, which, along with relentless US Dollar buying, acts as a tailwind for the USD/CAD pair.

From a technical perspective, the overnight sustained strength above the 1.3400 mark, representing the top end of over a two-month-old descending channel, was seen as a fresh trigger for bulls. A subsequent move beyond the 50-day SMA supports prospects for a further appreciating move.

Spot prices, however, struggle to find acceptance above the 100-day SMA amid overbought RSI (14) on hourly charts. Hence, it will be prudent to wait for a convincing break through the said barrier, currently around the 1.3520 region, before placing fresh bullish bets around the USD/CAD pair.

The subsequent positive momentum should allow bulls to surpass an intermediate barrier near the 1.3570 area and aim to reclaim the 1.3600 round-figure mark. The upward trajectory could get extended further towards retesting the YTD peak, around the 1.3680-1.3685 region touched in January.

On the flip side, any subsequent pullback below the 1.3475-1.3470 horizontal resistance breakpoint, coinciding with the 50-day SMA, could be seen as a buying opportunity and remain limited near the 1.3400 mark. The latter should act as a strong base for the USD/CAD pair, which if broken might negate the positive outlook.

USD/CAD daily chart

fxsoriginal

Key levels to watch

USD/CAD

Overview
Today last price1.3501
Today Daily Change0.0044
Today Daily Change %0.33
Today daily open1.3457
 
Trends
Daily SMA201.3373
Daily SMA501.3473
Daily SMA1001.3521
Daily SMA2001.3244
 
Levels
Previous Daily High1.3479
Previous Daily Low1.3358
Previous Weekly High1.3476
Previous Weekly Low1.3338
Previous Monthly High1.3685
Previous Monthly Low1.33
Daily Fibonacci 38.2%1.3433
Daily Fibonacci 61.8%1.3404
Daily Pivot Point S11.3383
Daily Pivot Point S21.3309
Daily Pivot Point S31.3261
Daily Pivot Point R11.3505
Daily Pivot Point R21.3553
Daily Pivot Point R31.3626

Author

Haresh Menghani

Haresh Menghani is a detail-oriented professional with 10+ years of extensive experience in analysing the global financial markets.

More from Haresh Menghani
Share:

Markets move fast. We move first.

Orange Juice Newsletter brings you expert driven insights - not headlines. Every day on your inbox.

By subscribing you agree to our Terms and conditions.

Editor's Picks

EUR/USD softens below 1.1750 amid ECB rate hold expectations

The EUR/USD pair declines to around 1.1730 during the early European session on Wednesday, pressured by renewed US Dollar demand. Nonetheless, the potential downside for the major pair might be limited amid the growing acceptance that the European Central Bank is done cutting interest rates. 

When is the UK CPI inflation data and how could it affect GBP/USD?

The United Kingdom Office for National Statistics will publish the highly relevant Consumer Price Index (CPI) data for November on Wednesday at 07:00 GMT. GBP/USD is likely to stay subdued if UK CPI meets expectations. However, any upside surprise could cap losses by tempering dovish sentiment ahead of the Bank of England’s policy decision on Thursday. 

Gold: Bulls await breakout through multi-day-old range amid Fed rate cut bets

Gold attracts fresh buyers during the Asian session on Wednesday, though it remains confined in a multi-day-old trading range amid mixed fundamental cues. The global risk sentiment remains on the defensive amid economic woes and fears of the AI bubble burst. Moreover, dovish US Federal Reserve expectations lend support to the non-yielding yellow metal, though a modest US Dollar uptick might cap any further appreciating move.

Bitcoin, Ethereum and Ripple extend correction as bearish momentum builds

Bitcoin, Ethereum, and Ripple remain under pressure as the broader market continues its corrective phase into midweek. The weak price action of these top three cryptocurrencies by market capitalization suggests a deeper correction, as momentum indicators are beginning to tilt bearish.

Ukraine-Russia in the spotlight once again

Since the start of the week, gold’s price has moved lower, but has yet to erase the gains made last week. In today’s report we intend to focus on the newest round of peace talks between Russia and Ukraine, whilst noting the release of the US Employment data later on day and end our report with an update in regards to the tensions brewing in Venezuela.

AAVE slips below $186 as bearish signals outweigh the SEC investigation closure

Aave (AAVE) price continues its decline, trading below $186 at the time of writing on Wednesday after a rejection at the key resistance zone. Derivatives positioning and momentum indicators suggest that bearish forces still dominate in the near term.