USD/CAD Price Analysis: Stays pressured towards 1.3690 support


  • USD/CAD fades bounce off three-week-old support line, grinds lower of late.
  • Receding bullish bias of MACD, descending RSI line lure sellers.
  • 100, 200 EMAs act as additional downside filters.
  • Weekly descending trend line holds the key to Loonie pair’s run-up towards refreshing 2023 top.

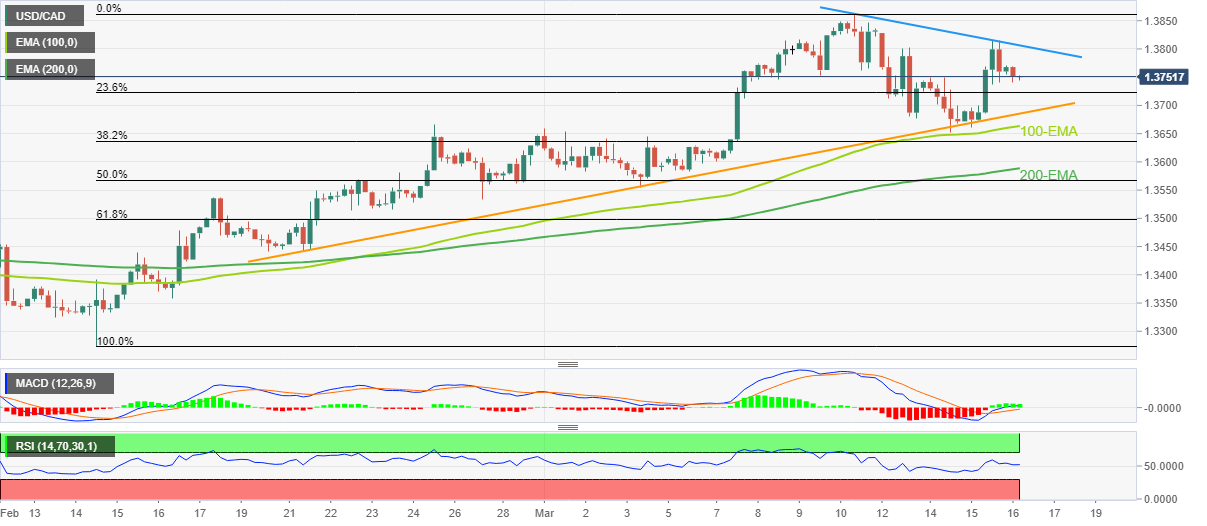
USD/CAD holds lower ground near 1.3750 as it pares the biggest daily gains in a week during early Thursday morning in Europe. In doing so, the Loonie pair fades the previous day’s bounce off a three-week-old ascending support line while printing mild losses of late.

Apart from failing to rebound from the short-term key support, the receding bullish bias of the MACD signals and the RSI (14) line’s downward move, not oversold, also keeps the USD/CAD bears hopeful of poking the 1.3690 level, comprising the aforementioned trend.

It’s worth noting, however, that the 100-bar and 200-bar Exponential Moving Averages (EMAs), respectively near 1.3660 and 1.3585, could challenge the USD/CAD bears afterward.

Also acting as a downside filter is the 50% Fibonacci retracement level of the pair’s February-March upside, near 1.3565.

On the flip side, a downward-sloping resistance line from March 10, close to 1.3810 at the latest, appears crucial for the USD/CAD buyers to watch during the pair’s further upside as a clear break of which could quickly refresh the year 2023 peak, currently around 1.3860.

In that case, October 2022 peak surrounding 1.3980 and the 1.4000 psychological magnet will gain major attention.

USD/CAD: Four-hour chart

Trend: Further downside expected

Additional important levels

Overview
Today last price 1.3745
Today Daily Change -0.0022
Today Daily Change % -0.16%
Today daily open 1.3767
 
Trends
Daily SMA20 1.3632
Daily SMA50 1.3489
Daily SMA100 1.3507
Daily SMA200 1.333
 
Levels
Previous Daily High 1.3814
Previous Daily Low 1.366
Previous Weekly High 1.3862
Previous Weekly Low 1.3582
Previous Monthly High 1.3666
Previous Monthly Low 1.3262
Daily Fibonacci 38.2% 1.3756
Daily Fibonacci 61.8% 1.3719
Daily Pivot Point S1 1.368
Daily Pivot Point S2 1.3593
Daily Pivot Point S3 1.3526
Daily Pivot Point R1 1.3835
Daily Pivot Point R2 1.3902
Daily Pivot Point R3 1.3989


Share: Feed news

Information on these pages contains forward-looking statements that involve risks and uncertainties. Markets and instruments profiled on this page are for informational purposes only and should not in any way come across as a recommendation to buy or sell in these assets. You should do your own thorough research before making any investment decisions. FXStreet does not in any way guarantee that this information is free from mistakes, errors, or material misstatements. It also does not guarantee that this information is of a timely nature. Investing in Open Markets involves a great deal of risk, including the loss of all or a portion of your investment, as well as emotional distress. All risks, losses and costs associated with investing, including total loss of principal, are your responsibility. The views and opinions expressed in this article are those of the authors and do not necessarily reflect the official policy or position of FXStreet nor its advertisers. The author will not be held responsible for information that is found at the end of links posted on this page.

If not otherwise explicitly mentioned in the body of the article, at the time of writing, the author has no position in any stock mentioned in this article and no business relationship with any company mentioned. The author has not received compensation for writing this article, other than from FXStreet.

FXStreet and the author do not provide personalized recommendations. The author makes no representations as to the accuracy, completeness, or suitability of this information. FXStreet and the author will not be liable for any errors, omissions or any losses, injuries or damages arising from this information and its display or use. Errors and omissions excepted.

The author and FXStreet are not registered investment advisors and nothing in this article is intended to be investment advice.

Recommended content


Recommended content

Editors’ Picks

USD/JPY holds above 155.50 ahead of BoJ policy announcement

USD/JPY holds above 155.50 ahead of BoJ policy announcement

USD/JPY is trading tightly above 155.50, off multi-year highs ahead of the BoJ policy announcement. The Yen draws support from higher Japanese bond yields even as the Tokyo CPI inflation cooled more than expected. 

USD/JPY News

AUD/USD extends gains toward 0.6550 after Australian PPI data

AUD/USD extends gains toward 0.6550 after Australian PPI data

AUD/USD is extending gains toward 0.6550 in Asian trading on Friday. The pair capitalizes on an annual increase in Australian PPI data. Meanwhile, a softer US Dollar and improving market mood also underpin the Aussie ahead of the US PCE inflation data. 

AUD/USD News

Gold price keeps its range around $2,330, awaits US PCE data

Gold price keeps its range around $2,330, awaits US PCE data

Gold price is consolidating Thursday's rebound early Friday. Gold price jumped after US GDP figures for the first quarter of 2024 missed estimates, increasing speculation that the Fed could lower borrowing costs. Focus shifts to US PCE inflation on Friday. 

Gold News

Stripe looks to bring back crypto payments as stablecoin market cap hits all-time high

Stripe looks to bring back crypto payments as stablecoin market cap hits all-time high

Stripe announced on Thursday that it would add support for USDC stablecoin, as the stablecoin market exploded in March, according to reports by Cryptocompare.

Read more

US economy: Slower growth with stronger inflation

US economy: Slower growth with stronger inflation

The US Dollar strengthened, and stocks fell after statistical data from the US. The focus was on the preliminary estimate of GDP for the first quarter. Annualised quarterly growth came in at just 1.6%, down from the 2.5% and 3.4% previously forecast.

Read more

Forex MAJORS

Cryptocurrencies

Signatures