|

USD/CAD Price Analysis: Rises toward 1.3700 despite a bearish bias

  • USD/CAD gains ground despite a bearish bias suggested by daily chart analysis.
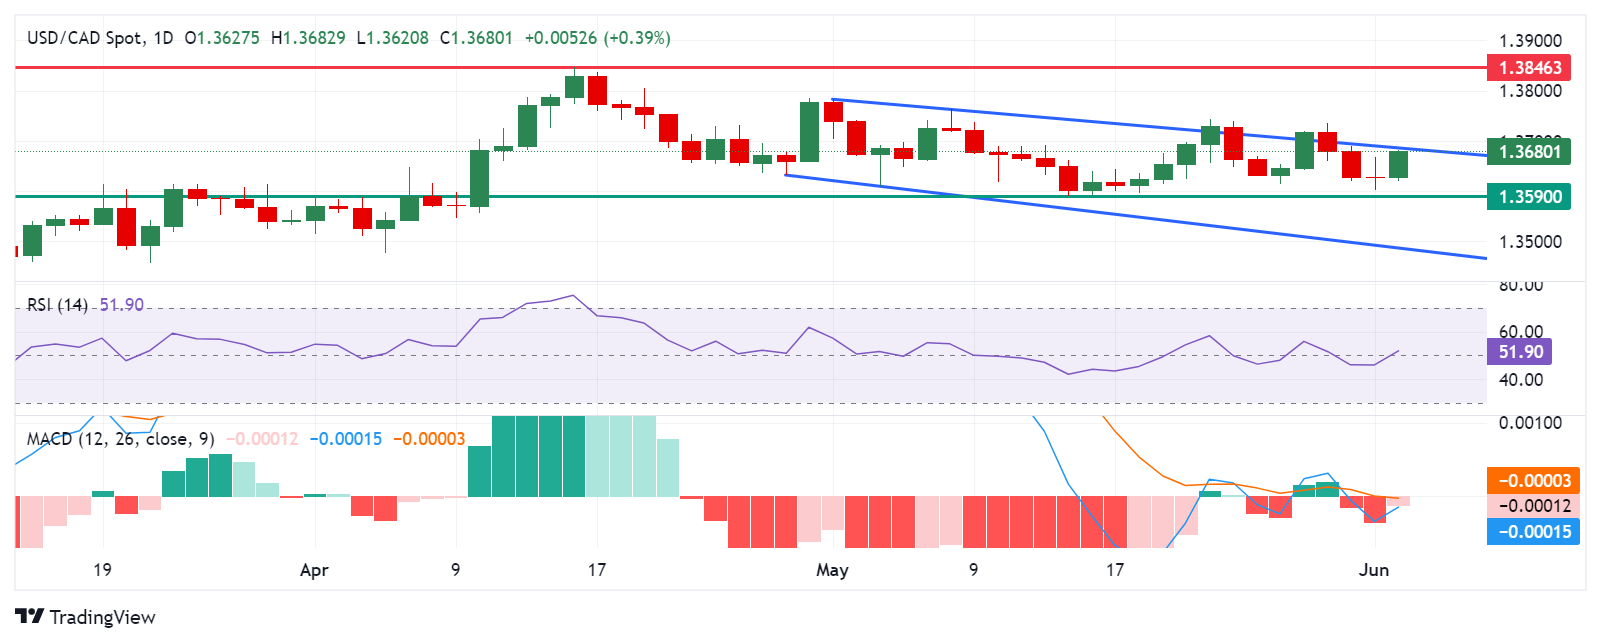
  • The momentum indicator MACD also suggests a bearish trend for the pair.
  • A break above the upper boundary of the descending channel and the psychological level of 1.3700 could weaken the bearish bias.

USD/CAD halts its three-day losing streak, trading around 1.3680 during the European hours on Tuesday. The appreciation of the pair is attributed to the decline in crude Oil prices, given the fact that Canada is the largest Oil exporter to the United States (US).

The analysis of the daily chart suggests the bearish bias for the USD/CAD pair, as it lies within the descending channel. Additionally, the 14-day Relative Strength Index (RSI) is positioned slightly above the 50 level, further movement may offer a clear directional trend.

The momentum indicator Moving Average Convergence Divergence (MACD) also suggests a bearish trend for the USD/CAD pair as the MACD line is positioned below the centerline and the signal line. However, the convergence below the signal line could lead to a momentum shift. A breakthrough above the centerline could weaken the bearish trend.

The USD/CAD pair could find the key support around the psychological level of 1.3600 and a throwback support of 1.3590. A break below this region could exert downward pressure on the pair to navigate around the significant level of 1.3500. Further support may appear at the lower threshold of the descending channel.

On the upside, the USD/CAD pair tests the upper boundary of the descending channel, followed by the psychological level of 1.3700. A breakthrough above the latter could weaken the bearish bias and lead the pair to explore the region around the key level of 1.3800, followed by April’s high of 1.3846.

USD/CAD: Daily Chart

USD/CAD

Overview
Today last price1.3679
Today Daily Change0.0052
Today Daily Change %0.38
Today daily open1.3627
 
Trends
Daily SMA201.3662
Daily SMA501.3662
Daily SMA1001.3582
Daily SMA2001.3575
 
Levels
Previous Daily High1.3669
Previous Daily Low1.3603
Previous Weekly High1.3735
Previous Weekly Low1.3615
Previous Monthly High1.3783
Previous Monthly Low1.359
Daily Fibonacci 38.2%1.3628
Daily Fibonacci 61.8%1.3644
Daily Pivot Point S11.3597
Daily Pivot Point S21.3567
Daily Pivot Point S31.3532
Daily Pivot Point R11.3663
Daily Pivot Point R21.3699
Daily Pivot Point R31.3729

Author

Akhtar Faruqui

Akhtar Faruqui is a Forex Analyst based in New Delhi, India. With a keen eye for market trends and a passion for dissecting complex financial dynamics, he is dedicated to delivering accurate and insightful Forex news and analysis.

More from Akhtar Faruqui
Share:

Markets move fast. We move first.

Orange Juice Newsletter brings you expert driven insights - not headlines. Every day on your inbox.

By subscribing you agree to our Terms and conditions.

Editor's Picks

EUR/USD holds steady above 1.1750 as traders await FOMC Minutes

The EUR/USD pair holds steady near 1.1770 during the early Asian session on Tuesday. Traders continue to price in the prospect of further rate cuts by the US Federal Reserve in 2026, following the 25-basis-point rate reduction delivered at the December meeting. The release of the Federal Open Market Committee Minutes will be in the spotlight later on Tuesday.

GBP/USD finds key support near 1.35 despite year-end grind

GBP/USD remains bolstered on the high end as markets grind through the last trading week of the year. Cable caught a bullish tilt to keep price action on the high side of the 1.3500 handle, though year-end holiday volumes are unlikely to see significant progress in either direction as 2025 draws to a close.

Gold holds above $4,300 after setting yet another record high

Spot Gold traded as high as $4,550 a troy ounce on Monday, fueled by persistent US Dollar weakness and a dismal mood. The XAU/USD pair was hit sharply by profit-taking during US trading hours and retreated towards $4,300, where buyers reappeared.

Crypto market outlook for 2026

Year 2025 was volatile, as crypto often is.  Among positive catalysts were favourable regulatory changes in the U.S., rise of Digital Asset Treasuries, adoption of AI and tokenization of Real-World-Assets.

Economic outlook 2026-2027 in advanced countries: Solidity test

After a year marked by global economic resilience and ending on a note of optimism, 2026 looks promising and could be a year of solid economic performance. In our baseline scenario, we expect most of the supportive factors at work in 2025 to continue to play a role in 2026.

Crypto market outlook for 2026

Year 2025 was volatile, as crypto often is.  Among positive catalysts were favourable regulatory changes in the U.S., rise of Digital Asset Treasuries (DAT), adoption of AI and tokenization of Real-World-Assets (RWA).