USD/CAD Price Analysis: Rebounds off key support, as the downtrend remains suspect


Share:
  • USD/CAD stalls its downtrend, finding support at 1.3489, just above the 200-day Moving Average, and trades 0.14% higher.
  • If the pair sustains above 1.3489, it could target resistance levels at 1.3550, 1.3580/90, and the psychological 1.3600 mark.
  • A break below 1.3489 could signal a bearish resumption, exposing the 200-DMA at 1.3463 and the 50-DMA at 1.3413.

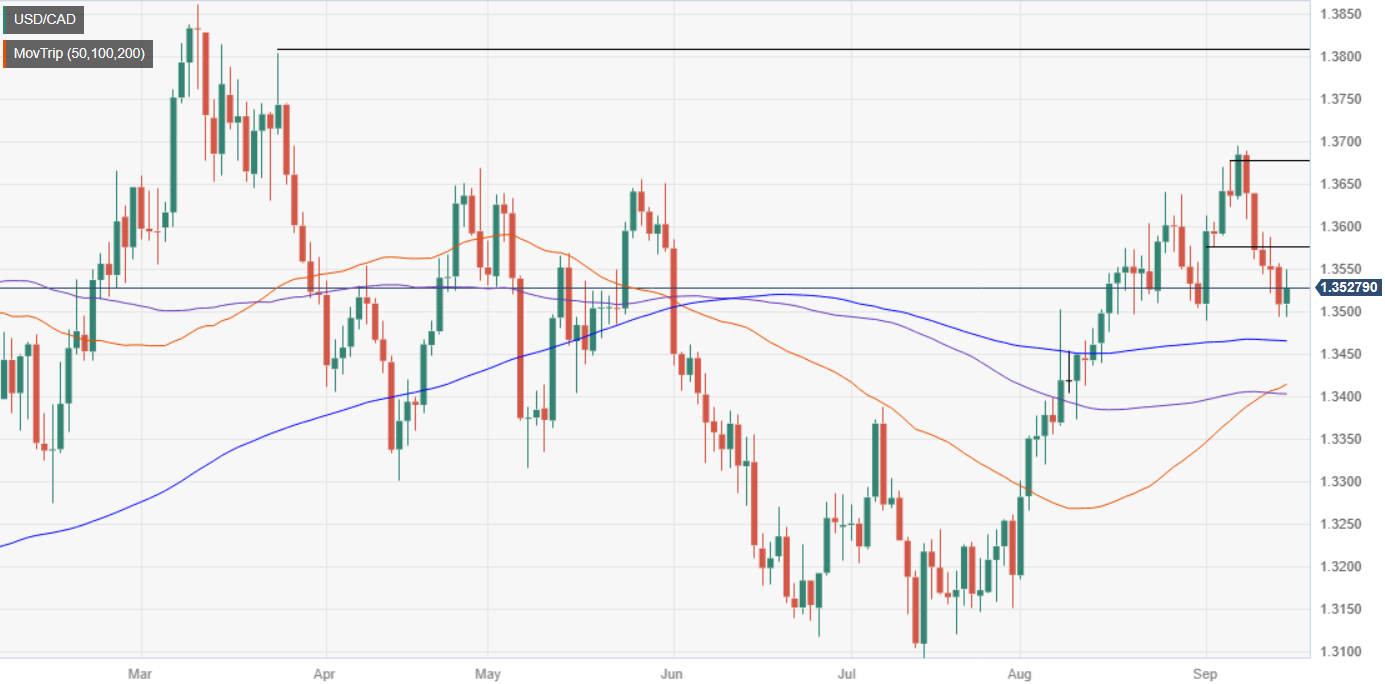
The USD/CAD downtrend stalls after the US Dollar found its footing, trimming some of its previous losses against the Loonie. Support emerged at around 1.3489, cushioning the pair’s fall and the 200-day Moving Average (DMA) sitting below that level. As of writing, the currency pair exchanges hands at 1.3527, up 0.14%.

From a daily chart perspective, the pair remains upward-biased despite the recent retracement. Sellers failed to drag prices below the September 1 swing low of 1.3489, which could exacerbate a leg up, and the USD/CAD could resume its uptrend in the short term. Hence, the first resistance would be the  1.3550 area, followed by the confluence of the September 12 and 13 highs at around 1.3580/90, immediately followed by the 1.3600 psychological level.

Contrarily, a bearish resumption would happen if the USD/CAD slumps below 1.3489, which could trigger a break in the market structure and expose the 200-DMA at 1.3463. A breach of the latter would expose the 50-DMA at 1.3413, followed by the July 7 daily high turned support at 1.3387.

USD/CAD Price Action – Daily chart

USD/CAD Technical Levels

USD/CAD

Overview
Today last price 1.3528
Today Daily Change 0.0020
Today Daily Change % 0.15
Today daily open 1.3508
 
Trends
Daily SMA20 1.3576
Daily SMA50 1.3409
Daily SMA100 1.3403
Daily SMA200 1.3466
 
Levels
Previous Daily High 1.3557
Previous Daily Low 1.3493
Previous Weekly High 1.3694
Previous Weekly Low 1.3576
Previous Monthly High 1.364
Previous Monthly Low 1.3184
Daily Fibonacci 38.2% 1.3518
Daily Fibonacci 61.8% 1.3532
Daily Pivot Point S1 1.3482
Daily Pivot Point S2 1.3456
Daily Pivot Point S3 1.3419
Daily Pivot Point R1 1.3546
Daily Pivot Point R2 1.3583
Daily Pivot Point R3 1.3609


Share: Feed news

Information on these pages contains forward-looking statements that involve risks and uncertainties. Markets and instruments profiled on this page are for informational purposes only and should not in any way come across as a recommendation to buy or sell in these assets. You should do your own thorough research before making any investment decisions. FXStreet does not in any way guarantee that this information is free from mistakes, errors, or material misstatements. It also does not guarantee that this information is of a timely nature. Investing in Open Markets involves a great deal of risk, including the loss of all or a portion of your investment, as well as emotional distress. All risks, losses and costs associated with investing, including total loss of principal, are your responsibility. The views and opinions expressed in this article are those of the authors and do not necessarily reflect the official policy or position of FXStreet nor its advertisers. The author will not be held responsible for information that is found at the end of links posted on this page.

If not otherwise explicitly mentioned in the body of the article, at the time of writing, the author has no position in any stock mentioned in this article and no business relationship with any company mentioned. The author has not received compensation for writing this article, other than from FXStreet.

FXStreet and the author do not provide personalized recommendations. The author makes no representations as to the accuracy, completeness, or suitability of this information. FXStreet and the author will not be liable for any errors, omissions or any losses, injuries or damages arising from this information and its display or use. Errors and omissions excepted.

The author and FXStreet are not registered investment advisors and nothing in this article is intended to be investment advice.

Follow us on Telegram

Stay updated of all the news

Join Telegram

Recommended content


Follow us on Telegram

Stay updated of all the news

Join Telegram

Recommended content

Editors’ Picks

EUR/USD drops below 1.0800 ahead of key US jobs data

EUR/USD drops below 1.0800 ahead of key US jobs data

EUR/USD is dropping below 1.0800 in the European session on Wednesday. The pair is dragged by a renewed uptick in the US Dollar, as markets trade with caution ahead of a busy EU and US economic docket. US ADP is the key event risk. 

EUR/USD News

GBP/USD battles 1.2600, with eyes on US ADP data

GBP/USD battles 1.2600, with eyes on US ADP data

GBP/USD is trading close to 1.2600, snapping a two-day losing streak in European trading on Wednesday. The modest US Dollar decline acts as a tailwind for the pair but the Pound Sterling struggles amid a cautious market mood. US jobs data awaited. 

GBP/USD News

Gold finds buyers near $2,020, awaits US ADP jobs data

Gold finds buyers near $2,020, awaits US ADP jobs data

Gold is finding a floor near $2,020 early Wednesday, snapping a two-day correction from all-time highs of $2,144 set on Monday. XAU/USD price capitalizes on a broad US Dollar retreat, as Greenback buyers take a breather following this week’s upswing and ahead of the top-tier US ADP Employment Change data.

Gold News

Bitcoin-based meme coin ORDI price action wobbles after 1,100% rally

Bitcoin-based meme coin ORDI price action wobbles after 1,100% rally

The Bitcoin-based BRC-20 meme coin, which had people confused as being an actual valuable token, is now slowly creeping up to that status. ORDI price rise over the past couple of days has been astonishing, and with BTC driving the price and crossing $44,000, ORDI is also gaining rapidly. But not for long.

Read more

The Dollar is struggling to trend

The Dollar is struggling to trend

For the last three trading sessions, the dollar index has been crossing up and down the 200-day moving average every day. All in all, the flirting with this level has been going on for more than three weeks, during which neither bulls nor bears were able to form a stable trend.

Read more

Forex MAJORS

Cryptocurrencies

Signatures