|

USD/CAD Price Analysis: Hovers around 1.3530, awaits Fed Powell's speech

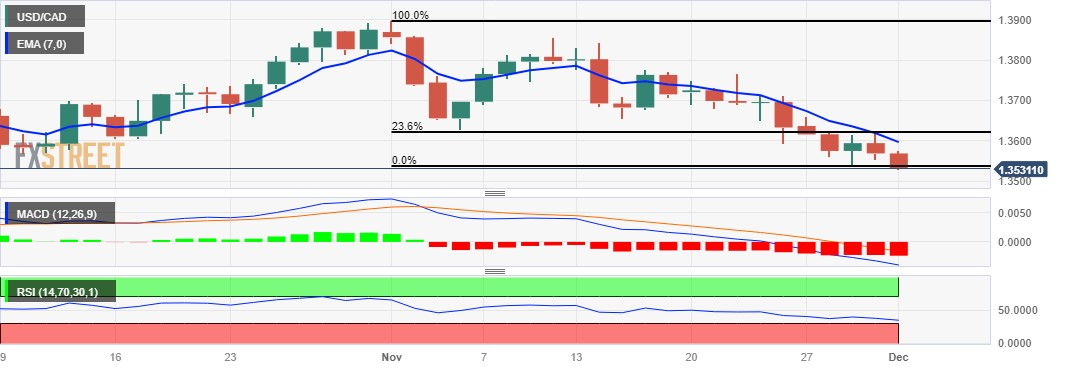
  • USD/CAD could extend its losses toward the 1.3500 psychological support level.
  • Technical indicators suggest bearish momentum in the pair.
  • A break above the 1.3550 could reach the seven-day EMA at 1.3596.

USD/CAD extends its losses for the second successive day, trading lower around 1.3530 during the European session on Friday. The weakened US Dollar (USD) exerts pressure and undermines the pair. Furthermore, the rebound in WTI prices could provide support to the Canadian Dollar (CAD), consequently putting downward pressure on the USD/CAD pair.

The technical indicators for the USD/CAD pair support the current downward trend. The Moving Average Convergence Divergence (MACD) line is below the centerline and shows the divergence below the signal line, indicating a bearish momentum in the USD/CAD pair.

Furthermore, the 14-day Relative Strength Index (RSI) below 50 indicates a dovish sentiment, indicating that the USD/CAD pair could meet the support around the psychological level around 1.3500, followed by the next support at 1.3450 level.

On the upside, the major level at 1.3550 could act as a key barrier following the seven-day Exponential Moving Average (EMA) at 1.3596 lined up with the psychological level at 1.3600.

A decisive breakthrough above the latter could open the doors for the USD/CAD pair to explore the barrier around 23.6% Fibonacci retracement at 1.3621.

A resurgence in the US Dollar (USD) could motivate the bulls in the USD/CAD pair to target the significant level at 1.3650, with the possibility of reaching the weekly high at 1.3661 if it successfully surpasses the mentioned resistance.

USD/CAD: Daily Chart

USD/CAD: other technical levels to watch

Overview
Today last price1.3533
Today Daily Change-0.0036
Today Daily Change %-0.27
Today daily open1.3569
 
Trends
Daily SMA201.3699
Daily SMA501.3685
Daily SMA1001.356
Daily SMA2001.3518
 
Levels
Previous Daily High1.3627
Previous Daily Low1.3552
Previous Weekly High1.3766
Previous Weekly Low1.3594
Previous Monthly High1.3899
Previous Monthly Low1.3541
Daily Fibonacci 38.2%1.3581
Daily Fibonacci 61.8%1.3598
Daily Pivot Point S11.3539
Daily Pivot Point S21.3508
Daily Pivot Point S31.3464
Daily Pivot Point R11.3613
Daily Pivot Point R21.3657
Daily Pivot Point R31.3687

Author

Akhtar Faruqui

Akhtar Faruqui is a Forex Analyst based in New Delhi, India. With a keen eye for market trends and a passion for dissecting complex financial dynamics, he is dedicated to delivering accurate and insightful Forex news and analysis.

More from Akhtar Faruqui
Share:

Markets move fast. We move first.

Orange Juice Newsletter brings you expert driven insights - not headlines. Every day on your inbox.

By subscribing you agree to our Terms and conditions.

Editor's Picks

EUR/USD rebounds after falling toward 1.1700

EUR/USD gains traction and trades above 1.1730 in the American session, looking to end the week virtually unchanged. The bullish opening in Wall Street makes it difficult for the US Dollar to preserve its recovery momentum and helps the pair rebound heading into the weekend.

GBP/USD steadies below 1.3400 as traders assess BoE policy outlook

Following Thursday's volatile session, GBP/USD moves sideways below 1.3400 on Friday. Investors reassess the Bank of England's policy oıtlook after the MPC decided to cut the interest rate by 25 bps by a slim margin. Meanwhile, the improving risk mood helps the pair hold its ground.

Gold stays below $4,350, looks to post small weekly gains

Gold struggles to gather recovery momentum and stays below $4,350 in the second half of the day on Friday, as the benchmark 10-year US Treasury bond yield edges higher. Nevertheless, the precious metal remains on track to end the week with modest gains as markets gear up for the holiday season.

Crypto Today: Bitcoin, Ethereum, XRP rebound amid bearish market conditions

Bitcoin (BTC) is edging higher, trading above $88,000 at the time of writing on Monday. Altcoins, including Ethereum (ETH) and Ripple (XRP), are following in BTC’s footsteps, experiencing relief rebounds following a volatile week.

How much can one month of soft inflation change the Fed’s mind?

One month of softer inflation data is rarely enough to shift Federal Reserve policy on its own, but in a market highly sensitive to every data point, even a single reading can reshape expectations. November’s inflation report offered a welcome sign of cooling price pressures. 

XRP rebounds amid ETF inflows and declining retail demand demand

XRP rebounds as bulls target a short-term breakout above $2.00 on Friday. XRP ETFs record the highest inflow since December 8, signaling growing institutional appetite.